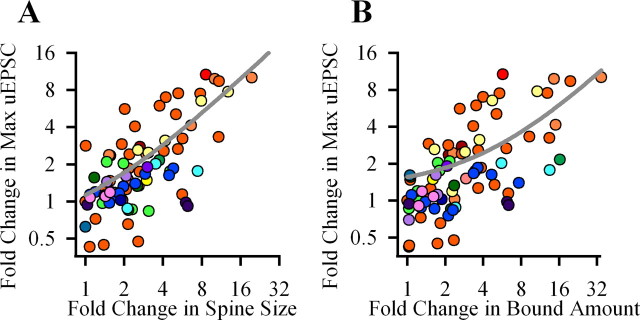
Figure 4.
Summary data for the correlation of postsynaptic uEPSC with spine bound amount of GFP-CaMKIIα or spine volume. Each data point is a result of comparison of two spines from the same dendrite. A, B, Each graph shows a fold change in one parameter versus fold change of another parameters: uEPSC versus spine volume (A) or versus bound amount of CaMKII (B). In A and B, data for each dendrite is color coded. Gray lines, Linear fits.

