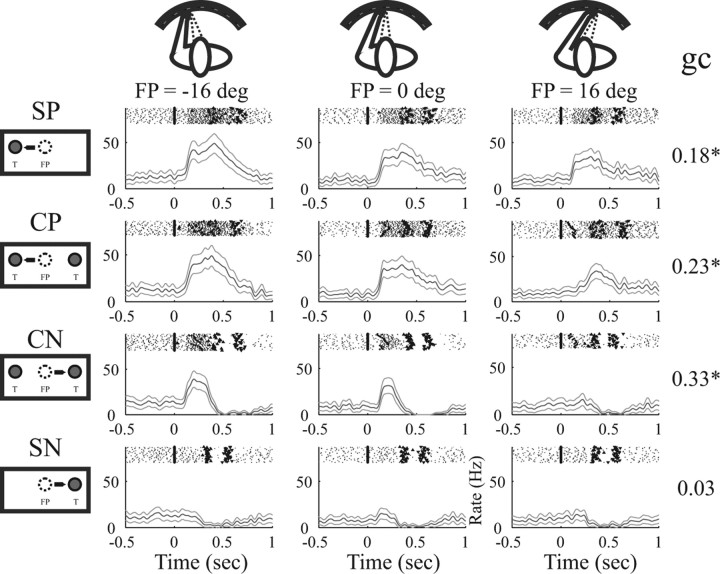
Figure 9.
Example neuron with gain modulation by the FP. Columns show activity in the reach task with the FP at −16, 0, and +16° (see icons on top). Rows of panels show the single-target task to the preferred (SP) and nonpreferred (SN) target and the choice task with selection of the preferred (CP) and nonpreferred (CN) target (see icons on the left). Each panel shows individual spike rasters on top of the PSTH (axes as in Fig. 3, alignment on T1). Numbers on the right indicate the gain coefficient (gc) for each task (*p < 0.05).

