
Figure 2.
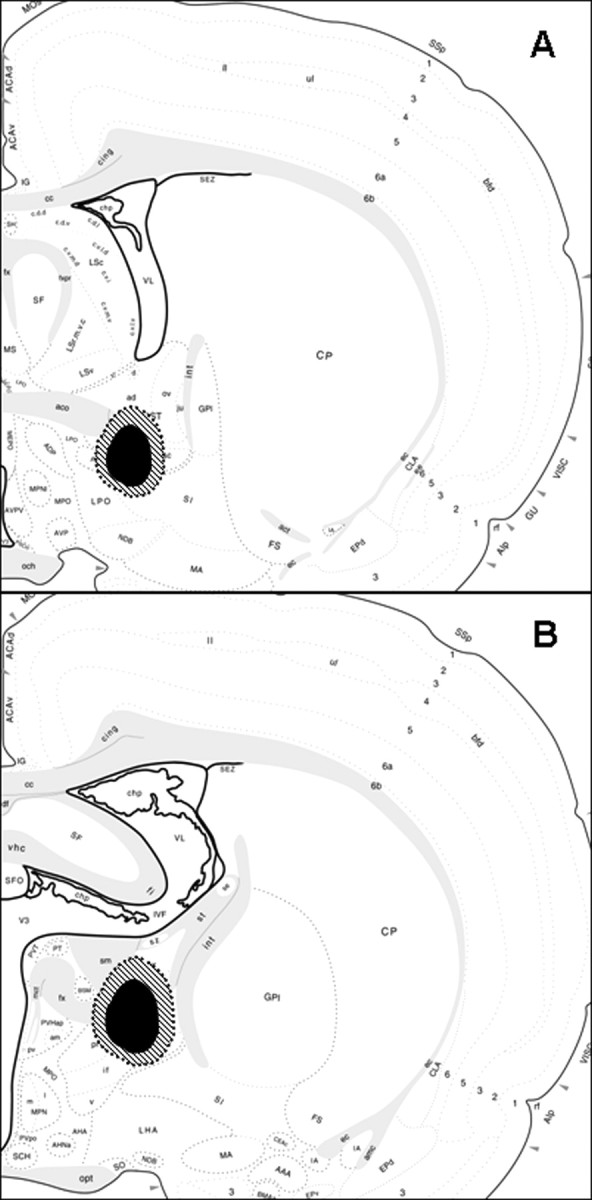
Schematic diagrams illustrate the extent of the spread of damage of the smallest (black shaded area) to the largest lesions (cross-hatched shaded area) confirmed as hits of either the anterior BST (A) or posterior BST (B). The images are adapted from the brain maps of Swanson (1998).