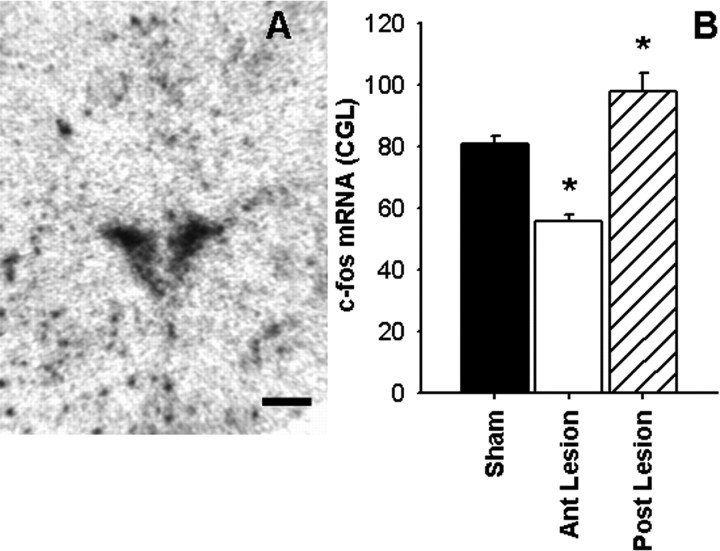
Figure 8.
Representative image of c-fos mRNA expression in the PVN of the hypothalamus (A). Semiquantitative analysis (B) revealed that c-fos mRNA expression was elevated in the PVN of the posterior (Post) BST lesion rats compared with sham rats. In contrast, c-fos mRNA expression was attenuated in the PVN of the anterior (Ant) BST lesion rats compared with sham rats. Data are shown as mean ± SEM; n = 7–12. *p < 0.05 versus sham. Scale bar, 500 μm.

