Figure 9.
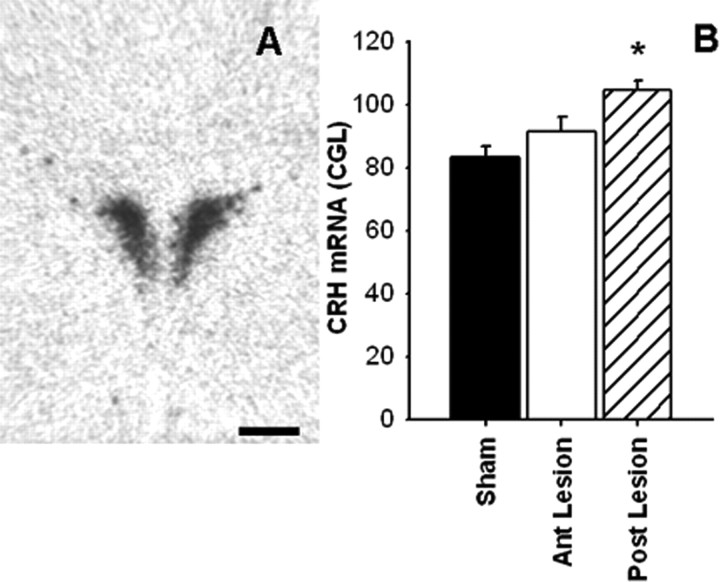
Representative image of CRH mRNA expression (A) in the PVN. Semiquantitative analysis (B) revealed that CRH mRNA expression was elevated in the PVN of the posterior (Post) lesion rats compared with shams, whereas anterior (Ant) BST lesion rats were not different compared with shams. Data are shown as mean ± SEM; n = 7–12. *p < 0.05 versus sham. Scale bar, 500 μm.

