
Figure 4.
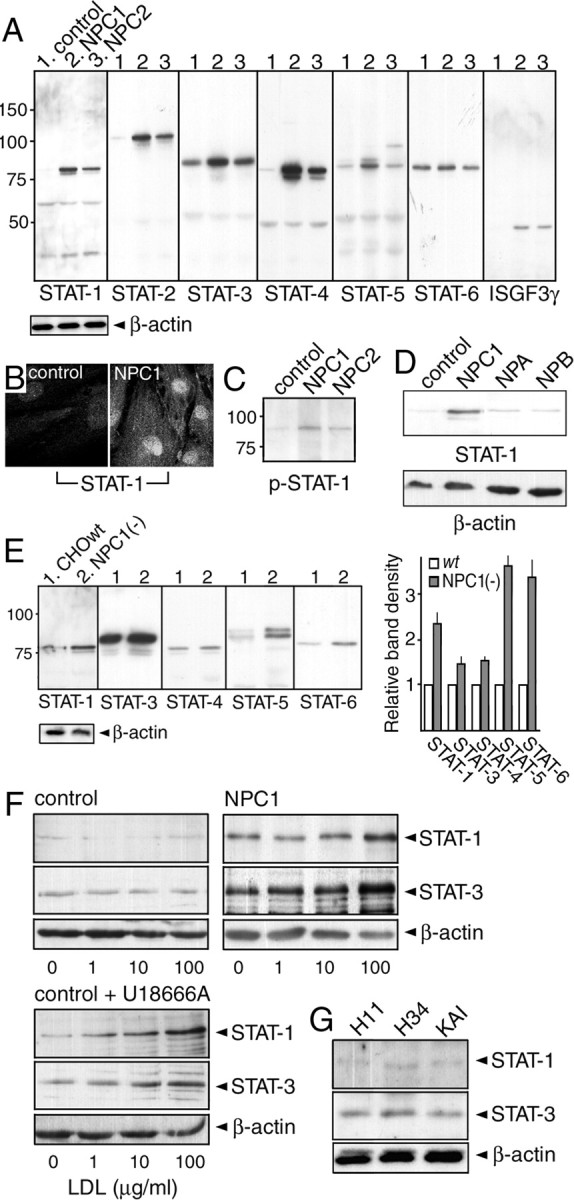
Levels of STATs in NPC cells. A, C, D, Levels of STATs and ISGF3γ in human fibroblasts. Proteins in 1% Triton X-100 extracts were detected by Western blotting with indicated antibodies. Cells were from a control subject (H11) and patients with NPC1 mutations (UCH), NPC2 mutations (81027), NPA (GM0112), and NPB (GM0252). A total of 10 μg of protein was loaded in each lane. Molecular weights are given on the left (in kilodaltons). B, STAT-1 immunofluorescence observed by confocal microscopy. E, Levels of STATs in NPC1-deficient CHO cells [NPC1(−) cells]. Signal intensity of the bands was normalized to that of β-actin, and the intensity in NPC1(−) cells was expressed as relative to that in wt cells. Each bar represents the mean ± SEM of three determinations. F, Effects of U18666A and LDL loading on STAT-1/STAT-3 levels. H34 and UCH cells were cultured in lipoprotein-deficient serum for 3 d, and then loaded with increasing concentrations of LDL for 24 h (top panels). In a separate set of H34 cells, they were loaded with LDL in the presence of 2 μg/ml U18666A (bottom panels). G, Levels of STAT-1/STAT-3 in KAI cells. Shown are the representative results, which were reproduced at least twice.