
Figure 8.
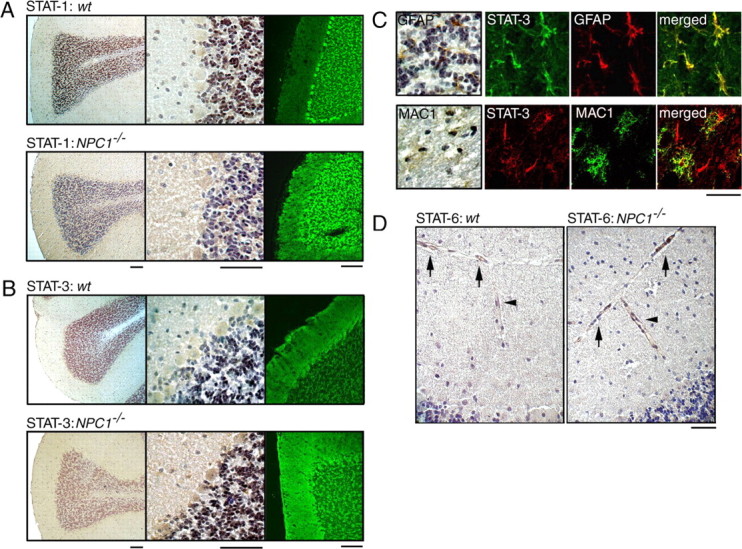
Cellular localizations of STATs in the NPC mouse cerebellum. Brain sections were obtained from 6-week-old littermates. A, B, STAT-1/STAT-3 immunostaining. Cerebellar sections were stained with indicated antibodies, and bound antibodies were detected by HRP-conjugated secondary antibody and visualized with DAB or by Alexa 488-conjugated secondary antibody followed by confocal imaging. Scale bars, 100 μm. C, Double immunofluorescence of NPC1−/− sections with STAT-3 and GFAP or MAC1. Images are from the granule cell layer (GFAP) or the white matter (MAC1). Bound antibodies were detected by Alexa 488- or Alexa 568-conjugated secondary antibodies. In the left panels, bound antibodies were detected by HRP-conjugated secondary antibody and visualized with DAB. Scale bar, 20 μm. D, STAT-6 immunostaining of blood vessels in the subarachnoid space (arrows) and the molecular cell layer (arrowheads). Scale bar, 100 μm. Shown are the representative results, which were reproduced at least twice.