
Figure 1.
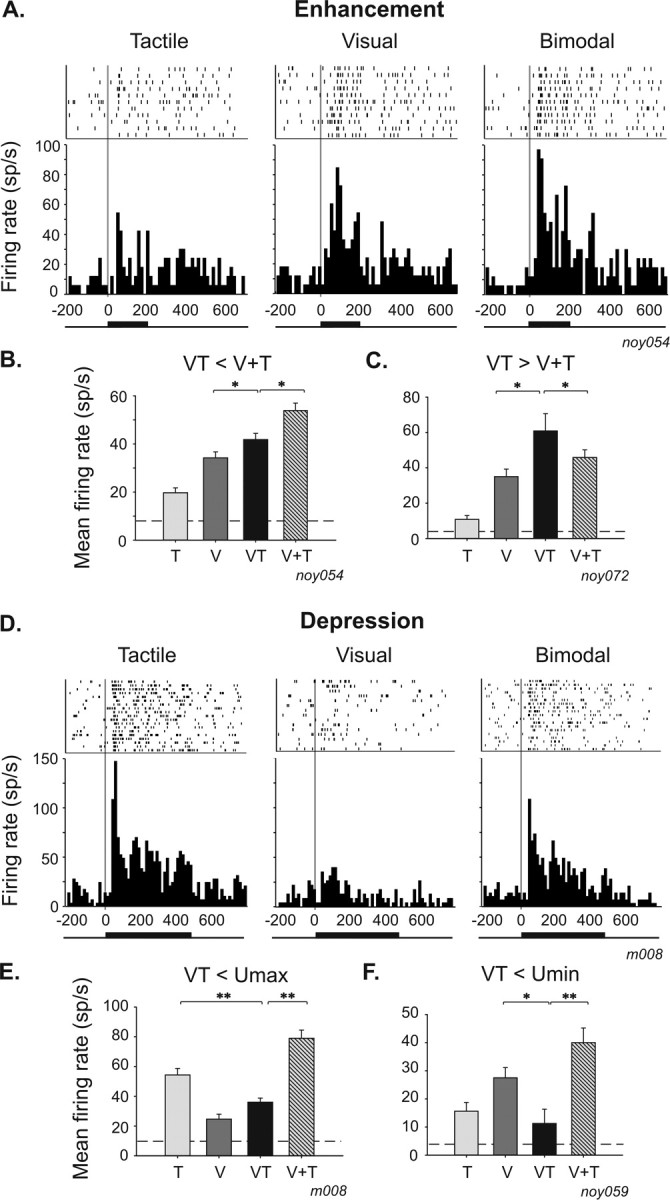
Single-cell examples of multisensory integration in bimodal neurons. Rasters and response peristimulus time histograms to tactile (left), visual (middle), and bimodal (right) stimulation. Bars on raster represent spikes, and rows indicate trials. Neuronal responses are aligned to stimulus onset (gray line). Peristimulus time histograms are the summed activity across all trials in a given stimulus condition (bin width of 15 ms). Tick lines at the bottom of the peristimulus time histograms represent stimulation duration. A–C, Single-cell examples of enhancement responses. A, The neuronal activity is significantly higher in the bimodal condition compared with the visual condition (t test, p = 0.05), and multisensory integration takes the form of a sub-additive enhancement (amplification index, +17%; additive index, −5%). B, Mean firing rate histogram of the same cell as in A of the visual (V), tactile (T), bimodal (VT), and arithmetical sum of visual and tactile (V+T) responses (t test, *p ≤ 0.05; **p ≤ 0.01). The dashed line represents spontaneous firing rate. C, Example of a super-additive enhancement effect in a bimodal neuron (t test, p = 0.05; amplification index, +30%; additive index, +21%). D–F, Single-cell examples of depression responses. D, Visual–tactile neuron whose tactile response is significantly depressed (t test, p = 0.01) by the concurrent presentation of a visual stimulus (amplification index, −20%; additive index, −33%). E, This integrative response falls between the tactile and the visual response. F, Example of a VIP neuron, for which the bimodal response is inferior to the minimal unimodal response (amplification index, −60%; additive index, −70%).