
Figure 2.
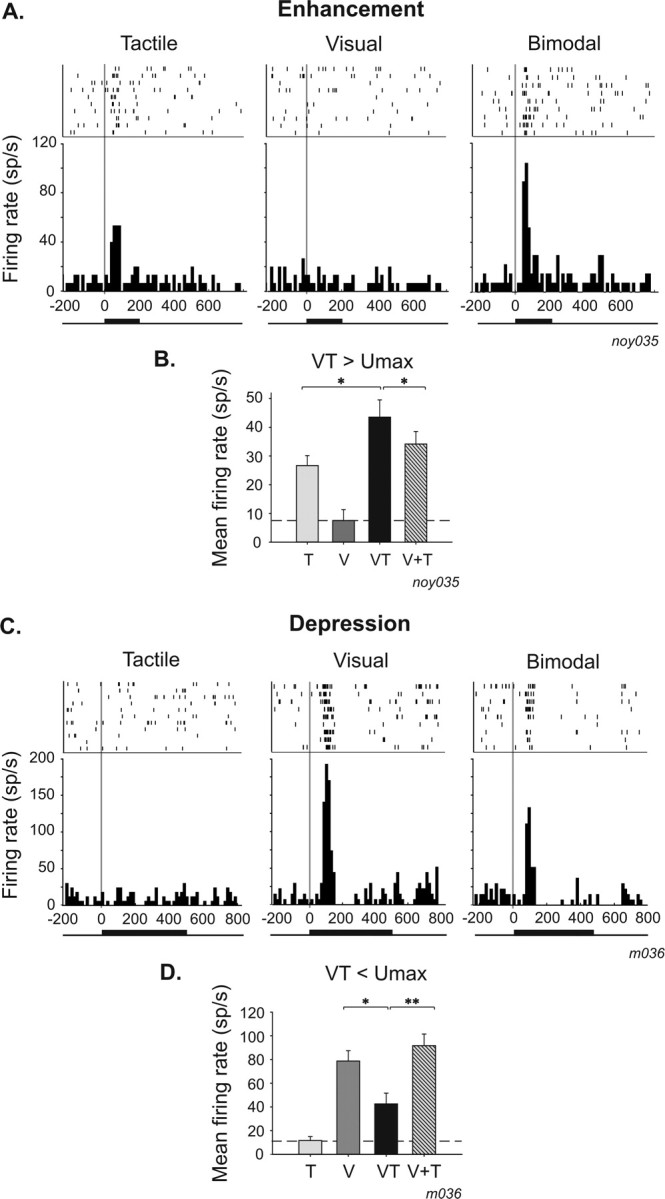
Single-cell examples of multisensory integration in unimodal neurons. A, B, Single-cell examples of enhancement responses. A, Unimodal tactile neuron (t test; tactile response, p = 0.001; visual response, p = 0.41) whose tactile response is significantly enhanced when combined with ineffective visual information (t test, p = 0.05; amplification index, +36%; additive index, +36%; the indices are identical because it is a unimodal cell: V+T will thus be equal to Unimax, and both indices are equivalent). B, Mean firing rate histogram of the same neuron. C, D, Single-cell examples of depression responses. C, Unimodal visual neuron (t test; visual, p = 0.001; tactile, p = 0.47) whose visual response is significantly depressed when combined with an ineffective tactile information (t test, p = 0.05; amplification index, −45%; additive index, −45%; here also the two indices are equal, for the same reasons as described above). D, Mean firing rate histogram of the same neuron. Same conventions as in Figure 1. V, Visual; T, tactile; VT, bimodal; V+T, arithmetical sum of visual and tactile.