
Figure 4.
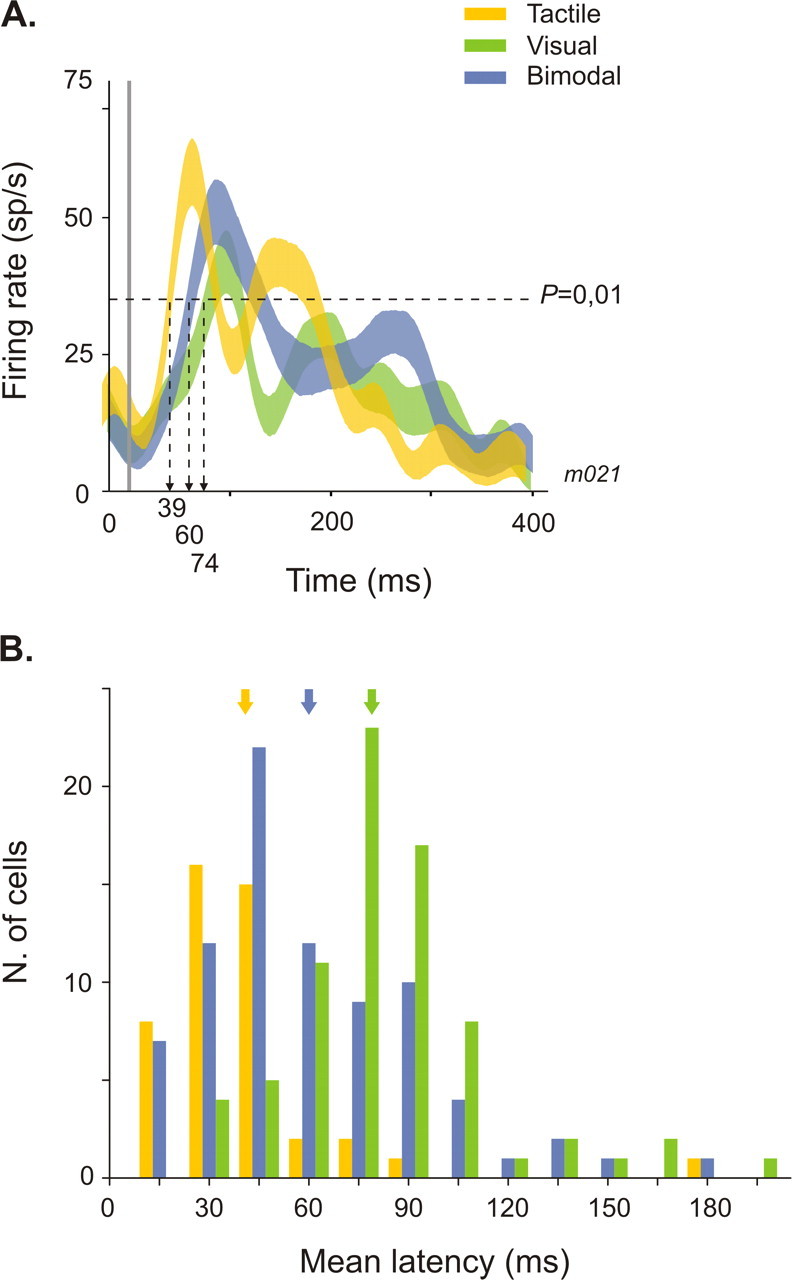
Multisensory integration effects on neuronal latency. A, Single-cell example. Bimodal response (blue spike density function) is significantly shorter than visual response (green) (one-way ANOVA, p = 0.01) and significantly longer than tactile response (yellow) (one-way ANOVA, p = 0.01). B, Distribution of tactile (yellow bars), visual (green), and visuo-tactile (blue) latencies in the population of bimodal integrative and non-integrative cells (n = 81). Arrows point to the mean tactile, visual, and bimodal latencies.