
Figure 5.
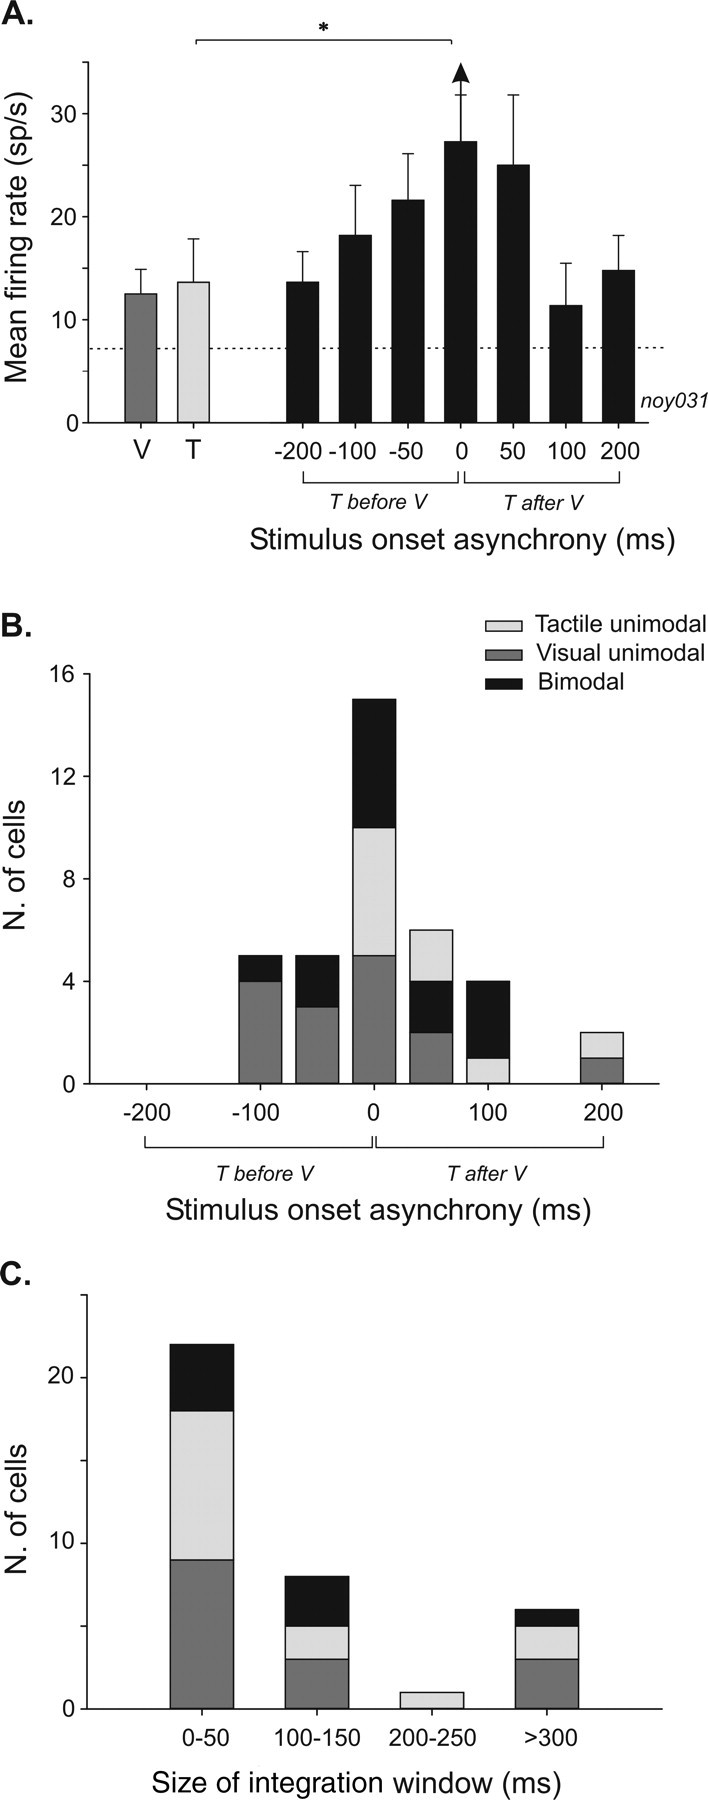
Effects of stimulus time onset asynchrony on multisensory integration in VIP. A, Histogram plot of a single-cell example of the mean firing rate as a function of SOA (error bars indicate mean ± SE). Single-modality responses of the cell are shown on the left part of the histogram (visual, dark gray bar; tactile, light gray bar). On the right part, bimodal responses to different SOA conditions are represented by black bars. Dashed line corresponds to the spontaneous activity. Multisensory integration is significant only when bimodal stimulations are synchronous (t test, *p = 0.05; amplification index, +34%; additive index, +6%). B, Population distribution of maximal integrative effects in function of stimulus onset asynchrony (n = 37). Same color conventions as in A. C, Population distribution of temporal window sizes in which multisensory integration can be found across the recorded population (n = 37). Same color conventions as in A. T, Tactile; V, visual.