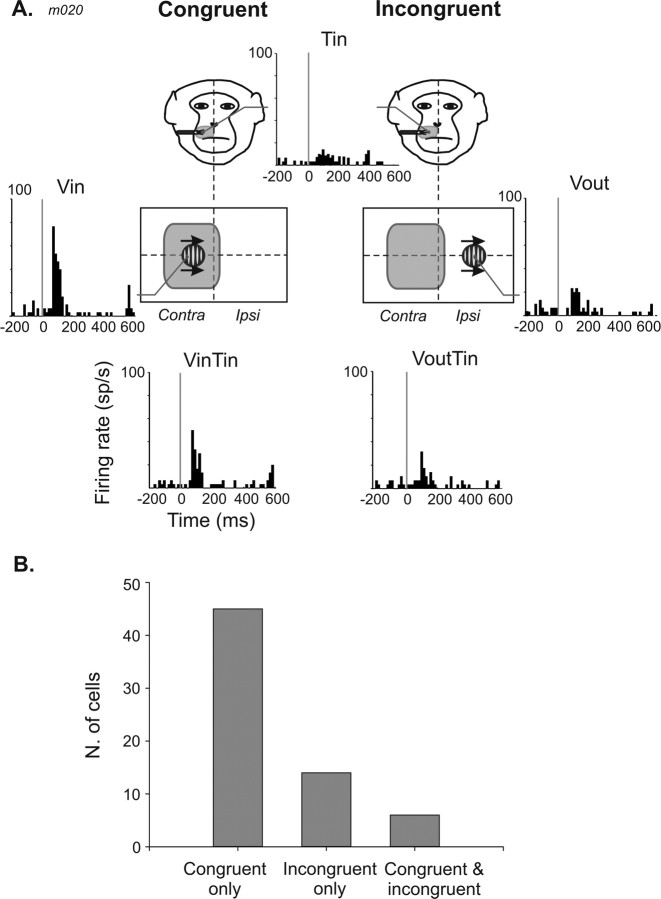
Figure 6.
Effect of spatial congruence on multisensory integration in VIP. A, Single-cell example, spatially congruent configuration (left) and incongruent configuration (right). At the top, the tactile response of the neuron and a drawing of the tactile receptive field location (shaded area) on a monkey face are shown. The tactile stimulus is always presented inside the tactile receptive field (Tin) in both configurations. The visual stimulus is either presented inside (Vin) or outside (Vout) the visual receptive field (middle panel, left and right, respectively). Schematic representation of the location of the visual stimulation is shown. At the bottom, the neuronal responses to congruent bimodal stimulations (Vin Tin, left) and incongruent bimodal stimulations (Vout Tin, right). B, Population distribution of multisensory integration effects as a function of spatial congruence/incongruence (n = 65).

