
Figure 5.
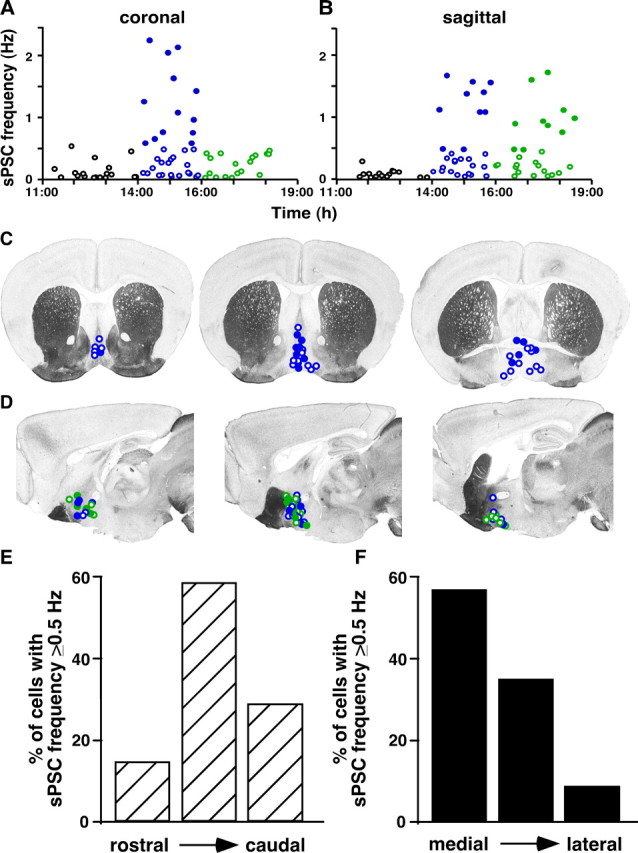
Approximately one in three GnRH neurons from OVX+E mice receive estradiol-induced increased GABA transmission during the surge, and this effect correlates with cell location. A, B, PSC frequency in all individual cells from OVX+E mice plotted versus the time of recording in coronal (A) and sagittal (B) slices. C, D, Approximate location of all GnRH neurons from OVX+E mice recorded during surge onset (coronal and sagittal) and surge peak (sagittal only). Slice images adapted from Paxinos and Franklin (2001). Coronal slices are displayed from rostral (left) to caudal (right), and sagittal slices are displayed medial (left) to lateral (right). The filled circles indicate cells with PSC frequency >0.5 Hz during surge onset (coronal and sagittal) and surge peak (sagittal only). The blue circles are cells recorded during surge onset, and the green circles are cells recorded during surge peak. E, F, Percentage of cells in each slice position that showed PSC frequency >0.5 Hz in coronal (E) and sagittal (F) slices.