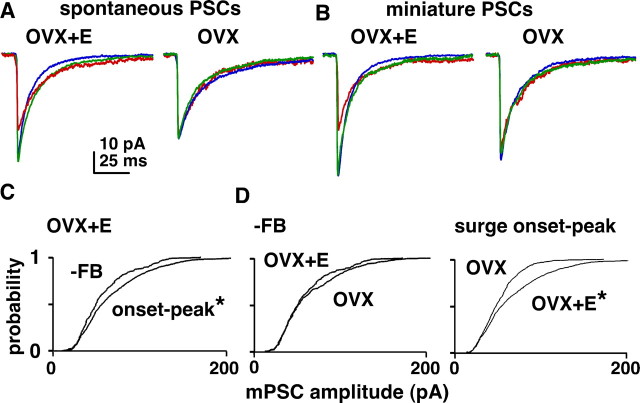
Figure 8.
Estradiol modulates amplitude of GABAergic PSCs. A, B, Averaged sPSC (A) and mPSC (B) traces from representative OVX+E (left) and OVX (right) cells during negative feedback (red), surge onset (blue), and surge peak (green). C, Cumulative probability distribution for mPSC amplitude comparing events in OVX+E cells during negative feedback (n = 205 events) and combined surge onset and peak times (n = 1104). D, Distributions comparing OVX and OVX+E events during negative feedback (top; OVX, n = 333) and combined surge onset and surge peak times (bottom; OVX, n = 758). *p < 0.05 versus −FB (C) and OVX (D).

