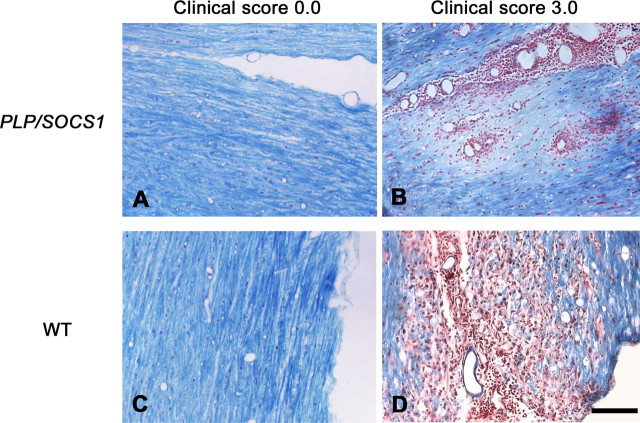
Figure 6.
Demyelination in wild-type and PLP/SOCS1 mice. A–D, Demyelination was assessed in LFB&NR-stained spinal cords sections of CFA-injected (A, C) and immunized mice at disease peak (clinical score, 3.0) (B, D). Scale bar, 100 μm. B, PLP/SOCS1 mice displayed focal loss of myelin, predominantly in the perivascular space, and little observable myelin debris (myelin pallor). D, In contrast, wild-type mice (WT) displayed myelin loss associated with diffuse infiltration of inflammatory cells between the myelinated tracts, presence of myelin debris, and phagocytosis. Note that B and D depict sequential sections to those in D and K.

