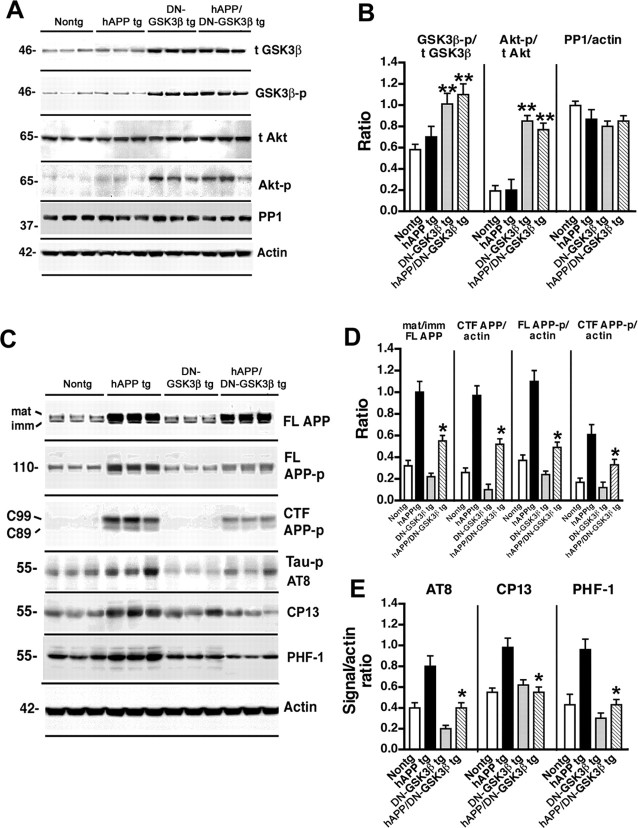
Figure 5.
Analysis of GSK3β levels and APP metabolism in hAPP/DN–GSK3β double tg mice. A, Representative Western blots demonstrating the patterns of immunoreactivity of t-GSK3β, GSK3β-p, t-Akt, Akt-p, and PP1 in homogenates from the frontal cortex of 6-month-old nontg, hAPP tg, DN–GSK3β tg, or hAPP/DN–GSK3β double tg mice. B, Image analysis of the levels of GSK3β-p, Akt-p, and PP1 in the frontal cortex of nontg, hAPP tg, DN–GSK3β tg, and hAPP/DN–GSK3β double tg mice. C, Representative Western blots demonstrating the patterns of immunoreactivity of mature (mat) and immature (imm) forms of FL APP, FL APP-p, CTF APP-p, tau-p AT8, CP13, and PHF-1 in homogenates from the frontal cortex of 6-month-old nontg, hAPP tg, DN–GSK3β tg, or hAPP/DN–GSK3β double tg mice. D, Image analysis of the ratio of mature/immature FL APP and the levels of CTF APP, FL APP-p, and CTF APP-p (mean of C99 and C89) in the frontal cortex of nontg, hAPP tg, DN–GSK3β tg, and hAPP/DN–GSK3β tg mice. E, Image analysis of the levels of tau-p AT8, CP13, and PHF-1 in the frontal cortex of nontg, hAPP tg, DN–GSK3β tg, and hAPP/DN–GSK3β double tg mice. *p < 0.05 compared with hAPP tg mice by unpaired two-tailed Student's t test; n = 6 mice per group. **p < 0.05 compared with nontg mice by unpaired two-tailed Student's t test; n = 6 mice per group.

