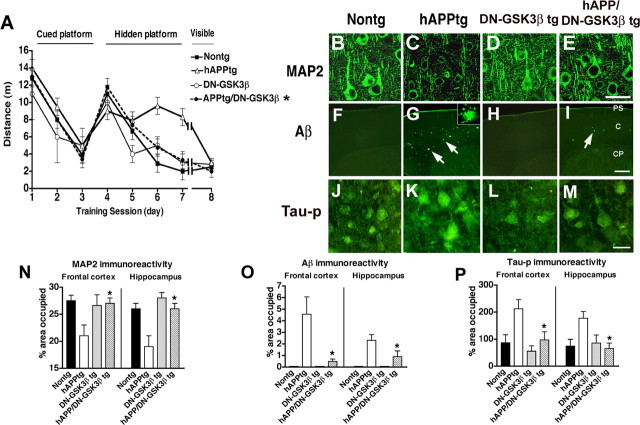
Figure 7.
Behavioral performance in the water maze and neuropathological analysis of dendritic structure and amyloid deposition in hAPP/DN–GSK3β double tg mice. A, During the hidden platform portion of the water maze test, hAPP tg mice showed performance deficits compared with nontg and DN–GSK3β tg mice that were ameliorated in the hAPP/DN–GSK3β tg mice. B, Laser scanning confocal microscopic image of MAP2 immunoreactivity in the frontal cortex of a nontg mouse. C, Decreased MAP2 immunoreactivity in the frontal cortex of an hAPP tg mouse. D, MAP2 immunoreactivity in the frontal cortex of a DN–GSK3β tg mouse. E, Restored MAP2 immunoreactivity in the frontal cortex of an hAPP/DN–GSK3β tg mouse. F, Low-power laser scanning confocal microscopic image of the frontal cortex of a nontg mouse immunostained with an antibody against Aβ (6E10). G, Increased amyloid deposition and plaques (arrows) in the frontal cortex of an hAPP tg mouse. Higher-power inset shows the morphology of an individual Aβ-immunoreactive plaque. H, Background levels of Aβ immunoreactivity in the frontal cortex of a DN–GSK3β tg mouse. I, Reduced Aβ immunoreactivity in the frontal cortex of an hAPP/DN–GSK3β tg mouse immunostained with an antibody against Aβ. PS, Pial surface; C, cortex; CP, caudoputamen. J, Laser scanning confocal microscopic image of tau-p (AT8) immunoreactivity in the frontal cortex of a nontg mouse. K, Increased tau-p immunoreactivity in the frontal cortex of an hAPP tg mouse. L, tau-p immunoreactivity in the frontal cortex of a DN–GSK3β tg mouse. M, Reduced tau-p immunoreactivity in the frontal cortex of an hAPP/DN–GSK3β tg mouse. N, Image analysis of the percentage area covered by MAP2 immunoreactivity in the frontal cortex and hippocampus of nontg, hAPP tg, DN–GSK3β tg, and hAPP/DN–GSK3β tg mice. O, Image analysis of the percentage area covered by Aβ-immunoreactive plaques in the frontal cortex and hippocampus of nontg, hAPP tg, DN–GSK3β tg, and hAPP/DN–GSK3β tg mice. P, Image analysis of the percentage area covered by tau-p immunoreactivity in the frontal cortex and hippocampus of nontg, hAPP tg, DN–GSK3β tg, and hAPP/DN–GSK3β tg mice. *p < 0.05 compared with hAPP tg mice by one-way ANOVA with post hoc Tukey–Kramer; n = 6 mice per group. Scale bars: B–E, J–M, 20 μm; F–I, 100 μm.

