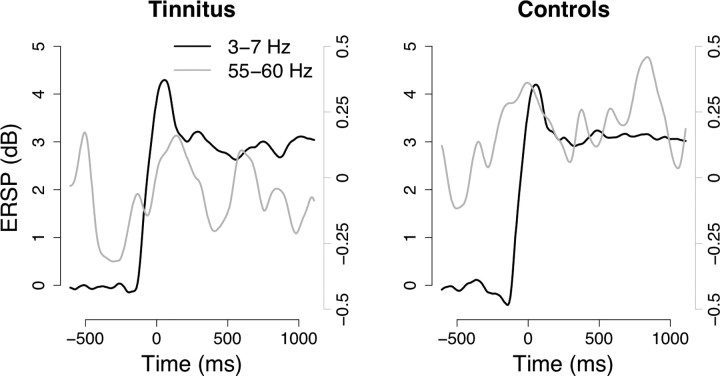
Figure 2.
Overlay of SWA (black line; left y-axis) and 55–60 Hz activity (gray line; right y-axis) for tinnitus and control subjects at the right temporal source. Control subjects in particular show a clear increase of gamma activity along with SWA, starting before SWA onset. In the same window, tinnitus subjects reduce their gamma activity, leading to the significant group difference observed in Figure 1.

