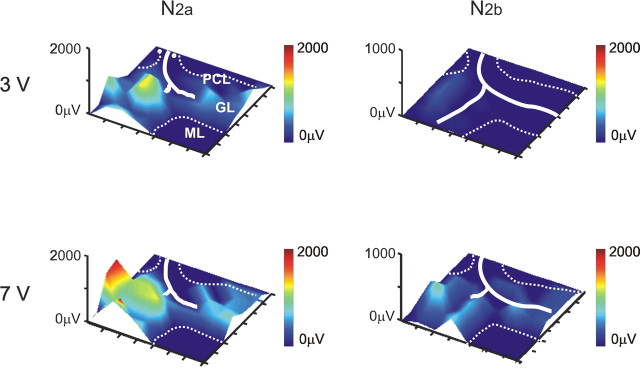
Figure 2.
Electrical maps of evoked granular layer activity. Electrical 3D maps for N2a and N2b were constructed from responses to mossy fiber stimulation at two different intensity (3 and 7 V). Pseudocolors improve perception of the vertical dimension. Excitation diffused to both sides of the mossy fiber bundle, revealing patches of activity. Increasing stimulation intensity enhanced the signal. In these and subsequent maps, the granular layer is delimited with thin dashed contours passing over the Purkinje cell layer, and continuous white lines indicate the mossy fiber bundle. Two white dots indicate the stimulation site. Also note that, to complete the graphic matrix, the corner points have been artificially set to 0.

