Figure 8.

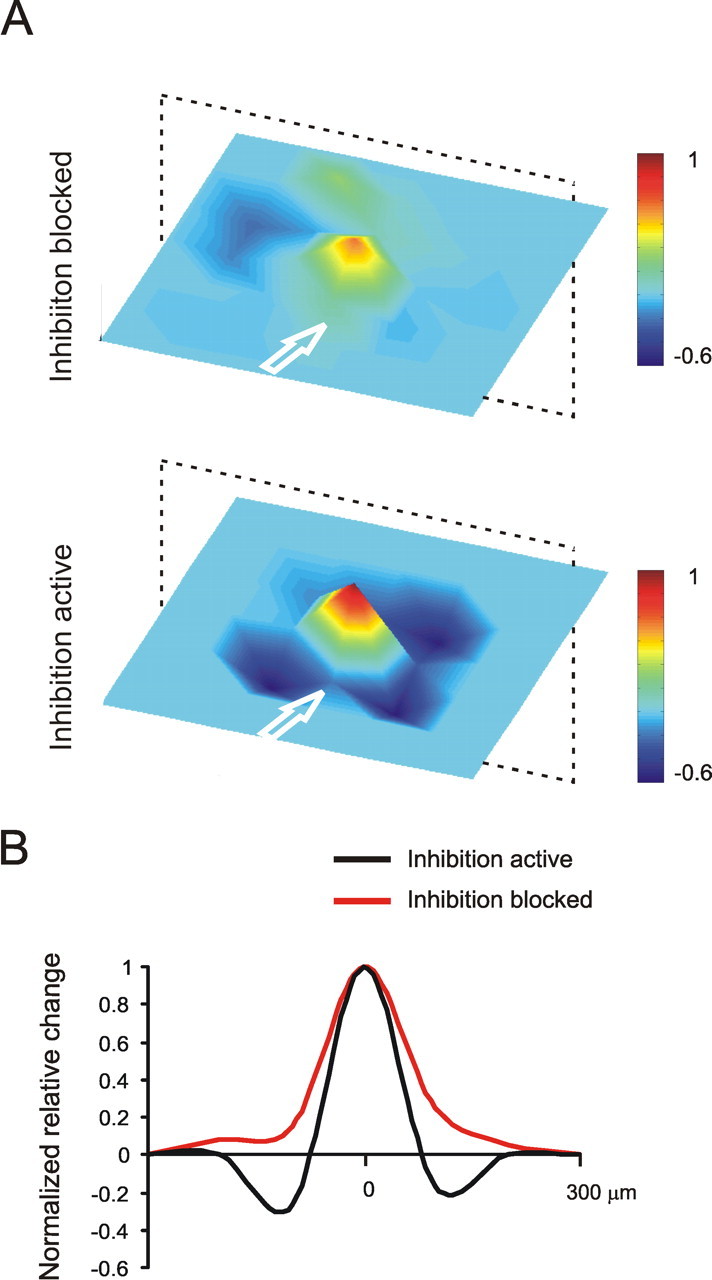
The spatial organization of synaptic plasticity. A, Average plasticity maps are generated from five experiments (62 electrodes) performed in the presence of bicuculline by centering over the electrodes showing maximal LTP and aligning the slices along the mossy fiber bundle (top panel). The averaging procedure was repeated for four MEA experiments and 38 electrodes in control solution (bottom panel). LTP emerges as a red-tipped cone surrounded by a blue ring of LTD, which is almost absent with bicuculline in the bath. B, The cross section reveals a Mexican-hat profile (black line). When synaptic inhibition is blocked by bicuculline (red line), LTD tends to disappear. Note that, because the 3D maps in A and B are rather symmetric, the cross section in a plane (indicated by a dotted frame) is representative of the average map profile.
