Figure 9.
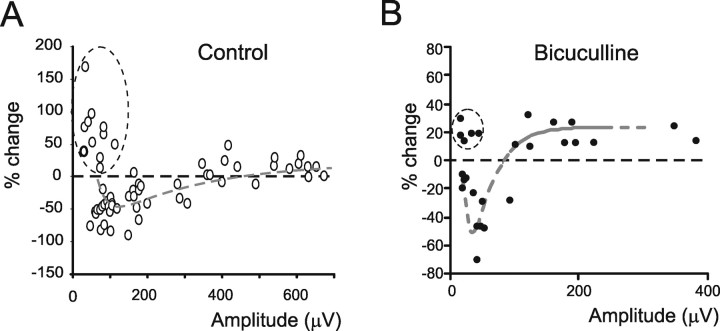
The relationship between plasticity and excitation (A). The plot shows the relationship between the relative change during long-term synaptic plasticity and excitation measured as N2a control amplitude. The data shown in this panel were obtained from the electrodes displaying significant N2a changes after TBS, as in B. Note that, for small N2a amplitudes, the electrodes usually show LTD, whereas at large amplitudes they tend to show LTP. The data are interpolated with a double exponential equation [y = y0 + A1 × exp(−(x − x0)/τ1) + A2 × exp(−(x − x0)/τ2), with y0 = 29.5, x0 = 45.13, A1 = 99.5, τ1 = 24.1, A2 = −93, and τ2 = 266; n = 62 electrodes from 4 slices; p(χ2) < 0.01]. Note also that, in the very low amplitude region, some data points (enclosed in a dashed circle) show LTP. These data have not been used for fitting. B, Same as in A, but in the presence of 10 μm bicuculline [double exponential fitting with y0 = 23.5, x0 = −12, A1 = 3354, τ1 = 9.65, A2 = −450, and τ2 = 31.1; n = 42 electrodes from 7 slices; p(χ2) < 0.01].

