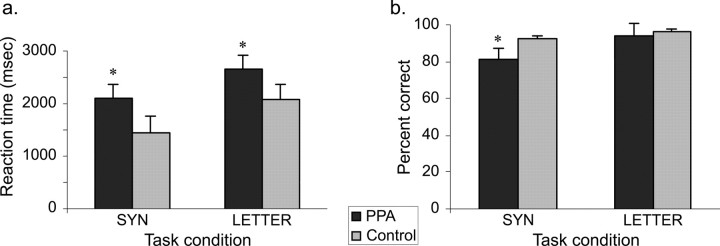
Figure 2.
Task performance results. Reaction times (in milliseconds) (a) and percentage accuracy (b) for the PPA patients and control subjects for the SYN (semantic task) and LETTER (visual task) conditions, with significant differences (p < 0.05) between the two groups indicated by an asterisk. Error bars indicate SEM.

