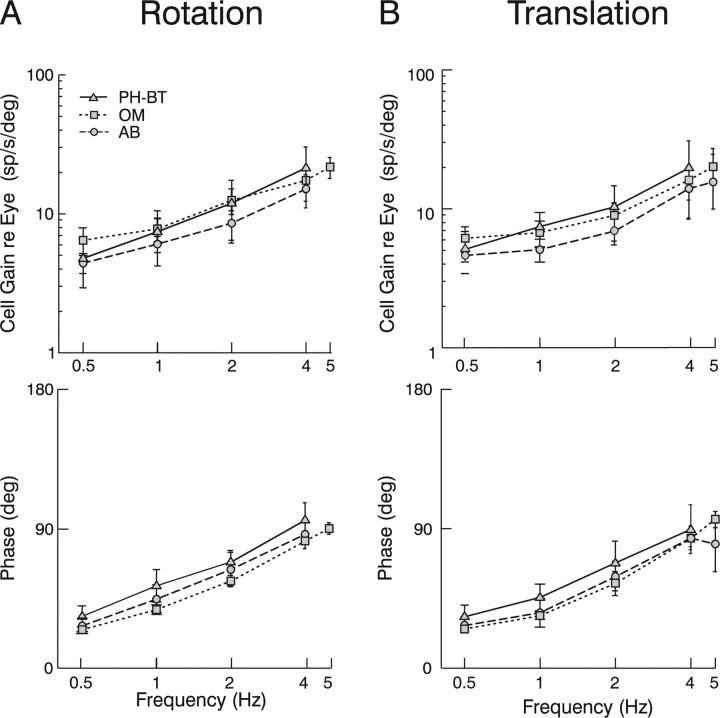
Figure 6.
Comparison of the dynamic characteristics of PH-BT cells with those of extraocular motoneurons. A, B, Neural response gains (top) and phases (bottom) relative to eye position of PH-BT cells (triangles, solid lines) and motoneurons in the abducens (circles, dashed lines) and oculomotor (squares, dotted lines) nuclei during rotation (A) and translation (B) are plotted as a function of frequency. Phases are expressed relative to the preferred eye position direction of the cell. AB, Abducens neurons; OM, oculomotor neurons. Error bars illustrate SD.

