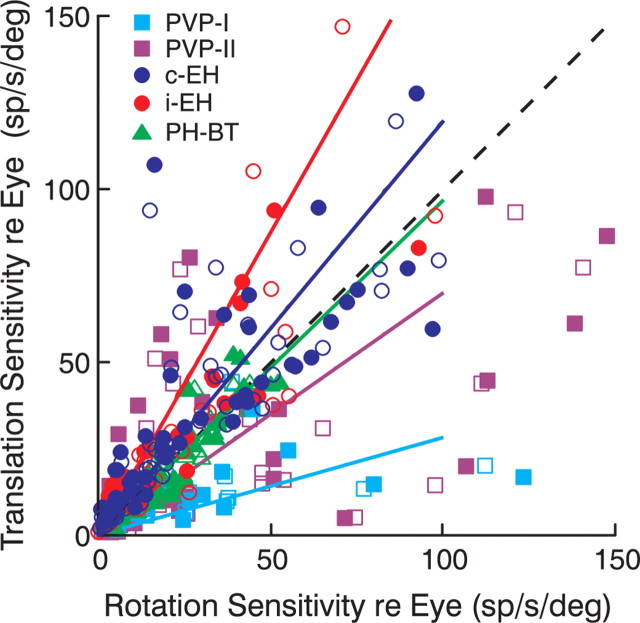
Figure 7.
Comparison of premotor cell responses during rotation and translation. Neural response gains relative to eye position across all frequencies during translation are compared with those during rotation under visual feedback (open symbols) and dark conditions (filled symbols). Different symbols and colors denote different cell types (cyan squares, PVP-I; purple squares, PVP-II; blue circles, c-EH; red circles, i-EH; green triangles, PH-BT). Solid lines indicate the regression slopes for data across all frequencies and lighting conditions (PVP-I: 0.28, 95% CI, 0.20–0.48; PVP-II: 0.70, 95% CI, 0.53–0.84; c-EH: 1.20, 95% CI, 1.06–1.39; i-EH: 1.75, 95% CI, 1.28–2.04; PH-BT: 0.97, 95% CI, 0.91–1.03). Dashed black line shows the unity slope.

