
Figure 1.
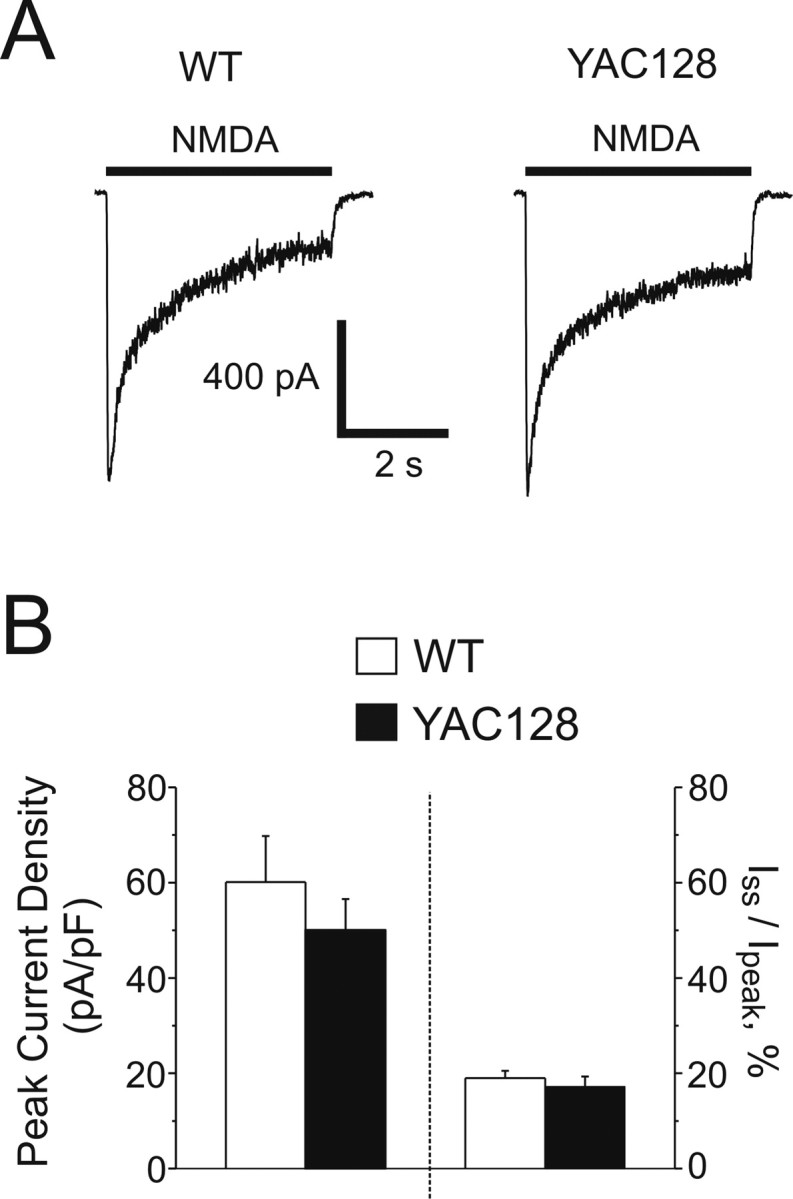
NMDAR current densities in WT and YAC128 MSNs. A, Representative whole-cell NMDAR currents from WT (left) and YAC128 (right) MSNs, evoked by the application of 1 mm NMDA. B, Left, Mean peak current densities (left y-axis) of WT (open bar, n = 28 cells) and YAC128 (filled bar, n = 20 cells) MSNs, not significant by unpaired t test. Data are expressed as mean ± SEM. Right, Iss/Ipeak values (right y-axis) for WT (19.0 ± 1.5%, n = 28 cells) and YAC128 MSNs (17.2 ± 2.1%, n = 20 cells, not significant by unpaired t test). Data are expressed as mean ± SEM.