Figure 3.
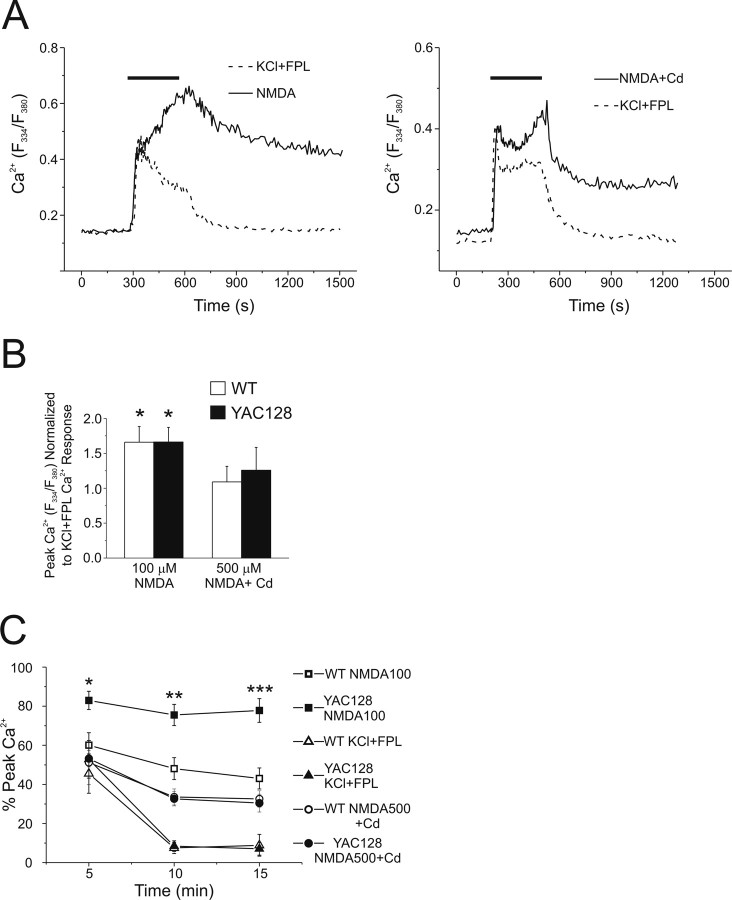
Contrasting responses of WT and YAC128 MSNs to different stimuli that increase cytosolic Ca2+. Intracellular Ca2+ was monitored using fura-FF in these experiments. A, Left, Representative mean responses of WT MSNs to 100 μm NMDA (solid line, n = 14 cells) or 50 mm KCl + 5 μm FPL64176 (dotted line, n = 23 cells). Right, Representative mean responses of WT MSNs to 500 μm NMDA + 0.2 mm Cd2+ (solid line, n = 19 cells) or 50 mm KCl + 5 μm FPL64176 (dotted line, n = 19 cells). B, Peak cytosolic Ca2+ responses to 100 μm NMDA (n = 6 experiments for WT, n = 5 for YAC128; total of 108 and 86 neurons for WT and YAC128, respectively, from 3 different culture batches) or 500 μm NMDA + 0.2 mm Cd2+ (n = 6 experiments, 98 cells total for WT; n = 6 experiments, 114 cells total for YAC128, from 2 different culture batches per genotype) normalized to peak cytosolic Ca2+ responses to 50 mm KCl + 5 μm FPL64176 (n = 12 experiments per genotype, total of 216 and 211 neurons for WT and YAC128, respectively, from 5 different culture batches) obtained in paired experiments in WT (open bars) or YAC128 (filled bars) MSNs. *p < 0.05 by single-factor t test (significantly different from 1.0). Data are expressed as mean ± SEM. C, Recovery of cytosolic Ca2+ toward prestimulus levels after 5 min of application of 100 μm NMDA (WT: open squares; YAC128: filled squares; n = 5 experiments per genotype, total of 97 and 86 neurons for WT and YAC128, respectively, from 3 different culture batches), 500 μm NMDA + 0.2 mm Cd2+ (n = 6 experiments, 98 cells total for WT; n = 6 experiments, 114 cells total for YAC128, from 2 different culture batches per genotype) or 50 mm KCl + 5 μm FPL64176 (WT: open triangles; YAC128: filled triangles; n = 12 experiments per genotype, total of 216 and 211 neurons for WT and YAC128, respectively, from 5 different culture batches). Significant difference in recovery of cytosolic Ca2+, WT versus YAC128 (100 μm NMDA): two-way ANOVA; effect of genotype F(1,21) = 36.76, p < 0.0001; *p < 0.05; **p < 0.01; ***p < 0.01 by Bonferroni posttest; effect of time F(2,21) = 2.23, p > 0.05.

