Figure 4.
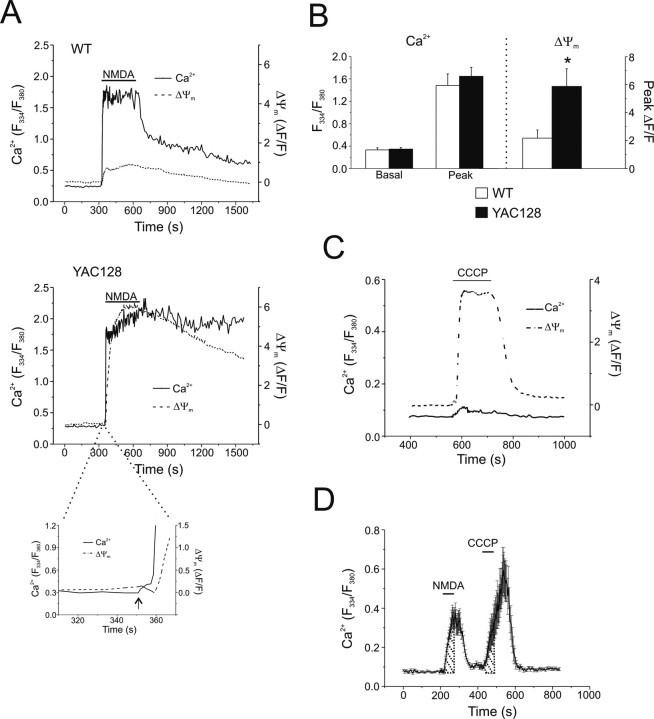
NMDA-induced changes in cytosolic Ca2+ and ΔΨm in WT and YAC128 MSNs. A, Representative mean cytosolic Ca2+ (solid line, fura-2) and mitochondrial ΔΨm (dashed line, rhodamine-123) responses of WT (top, n = 20 cells) and YAC128 (bottom, n = 15 cells) MSNs before, during, and after 5 min of application of 500 μm NMDA. Inset of YAC128 responses illustrates temporal order of changes in Ca2+ (solid line) preceding changes in ΔΨm (dashed line) during initial phase of response to NMDA (arrow indicates start of NMDA application). B, Left, Basal and peak cytosolic Ca2+ responses (F334/F380 measured using fura-2; left y-axis) to 500 μm NMDA in WT (open bars) or YAC128 (filled bars) MSNs. Not significant by paired t test; data are expressed as mean ± SEM. Right, Concurrent changes in ΔΨm (ΔF/F; right y-axis) in WT (open bar) or YAC128 (filled bar) MSNs (n = 8 paired experiments per genotype; total of 131 and 147 neurons for WT and YAC128, respectively, from 4 different culture batches). *p < 0.05 by paired t test; data are expressed as mean ± SEM. C, 5 μm CCCP-mediated mitochondrial depolarization in previously unstimulated Y128 MSNs results in very little free Ca2+ released from the mitochondria into the cytosol. Mean cytosolic Ca2+ (solid line, fura-FF) and ΔΨm (dashed line, rhodamine-123) responses of 13 MSNs. D, Representative example of mitochondrial Ca2+ uptake experiment, mean responses ± SEM of 13 WT MSNs shown. Fura-FF was used as the Ca2+ indicator. Shaded areas, determined by stimulus duration, were used in AUC calculations to determine C/N ratios.

