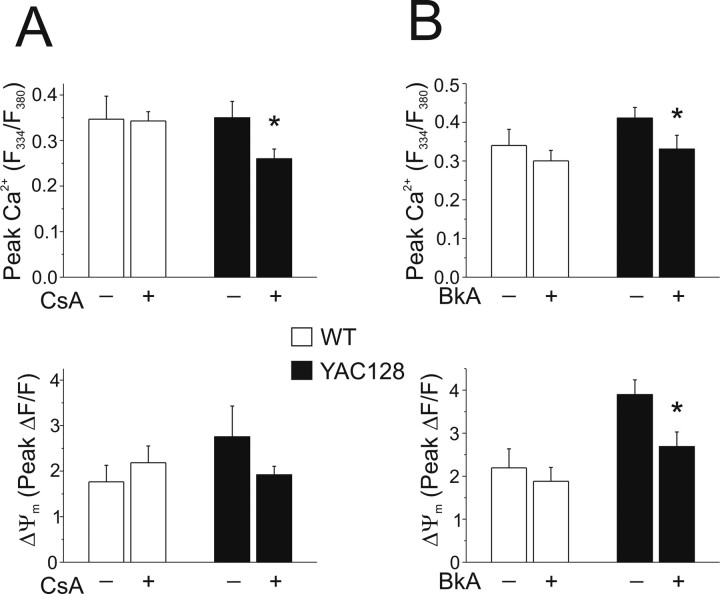
Figure 5.
Effect of mPT inhibitors on peak cytosolic Ca2+ and ΔΨm in WT and YAC128 MSNs. Intracellular calcium was monitored using fura-FF in these experiments. A, Top, Peak cytosolic Ca2+ in WT (open bars; with 10 μm CsA: n = 6 experiments, 81 neurons total; without 10 μm CsA: n = 6 experiments, 109 neurons total; from 3–4 different culture batches) and YAC128 (filled bars; with 10 μm CsA: n = 5 experiments, 106 neurons total; without 10 μm CsA: n = 7 experiments, 88 neurons total; from 3–4 different culture batches) MSNs after 5 min of application of 500 μm NMDA, with or without 10 μm CsA in all solutions (as indicated). *p < 0.05 by unpaired t test comparing treatments within genotype (see Materials and Methods); data are expressed as mean ± SEM. Bottom, Concurrent changes in ΔΨm (ΔF/F); not significant by unpaired t test, data are expressed as mean ± SEM. B, Top, Peak cytosolic Ca2+ in WT (open bars; with BkA: n = 9 experiments, 135 cells total; without BkA: n = 10 experiments, 129 cells total; from 5 different culture batches) and YAC128 (filled bars; with 5 μm BkA: n = 10 experiments, 145 cells total; without 5 μm BkA: n = 9 experiments, 148 cells total; from 5 different culture batches) MSNs after 5 min of application of 500 μm NMDA, with or without 5 μm BkA in all solutions (as indicated). Bottom, Concurrent changes in ΔΨm (ΔF/F). *p < 0.05 by unpaired t test comparing treatments within genotype (see Materials and Methods); data are expressed as mean ± SEM.

