
Figure 3.
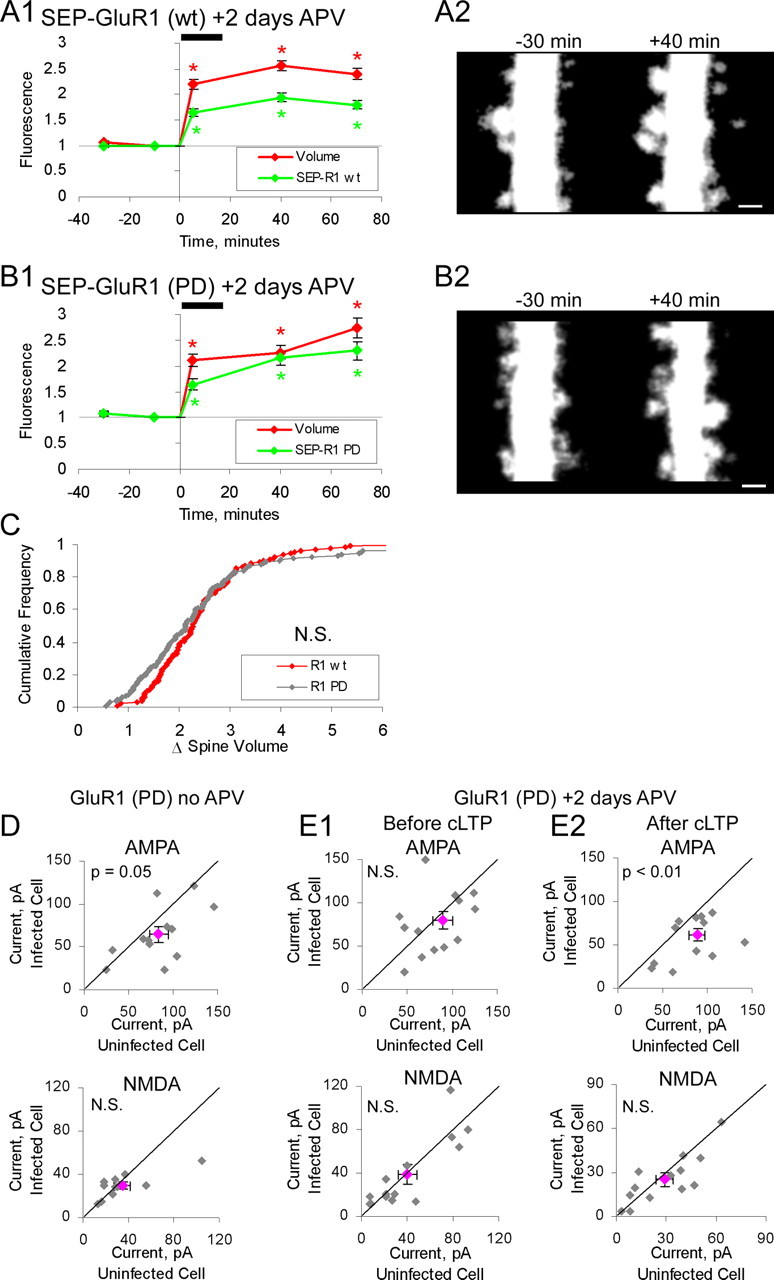
Ion channel function of GluR1 is not required for it to permit spine enlargement. A1, A2, Neurons expressing SEP-GluR1(wt) and tDimer (n = 124 spines; 3 cells). Slices incubated in 100 μm APV during 2 d expression period. APV was removed before imaging. A1, Mean spine volume (integrated red fluorescence) and spine SEP-GluR1 (integrated green fluorescence) relative to chemLTP induction. Values are normalized to −10 min time point (*p < 0.05). A2, Sample images obtained at indicated times relative to chemLTP induction (red channel only). Images are displayed as in Figure 2. B1, B2, Same as A for neurons expressing SEP-GluR1(PD) and tDimer (n = 145 spines; 3 cells). Slices treated as in A. B1, Mean spine volume (integrated red fluorescence) and spine SEP-GluR1(PD) (integrated green fluorescence) relative to chemLTP induction. B2, Sample images obtained at indicated times relative to chemLTP induction (red channel only). Images are displayed as in Figure 2. Scale bars, 1 μm. C, Cumulative distribution of fold spine volume change during chemLTP from cells expressing SEP-GluR1(wt) or SEP-GluR1(PD). Fold volume change is defined as in Figure 2. D, E, Paired whole-cell recordings of AMPAR- and NMDAR-mediated synaptic currents from uninfected cells and neighboring infected cells expressing GFP-GluR1(PD). Slices are treated as in A. AMPAR component defined as peak amplitude at −60 mV holding potential. NMDAR component is defined as mean amplitude from 110–160 ms after peak at +40 mV holding potential. Gray points, Individual data points; pink point, mean data point. D, Slice cultures not incubated in APV during the expression period (n = 12; AMPA, p = 0.05). E1, Neurons before cLTP induction (n = 14; AMPA, p = 0.36). E2, Neurons after cLTP induction (n = 14; AMPA, p < 0.01). Error bars represent SEM.