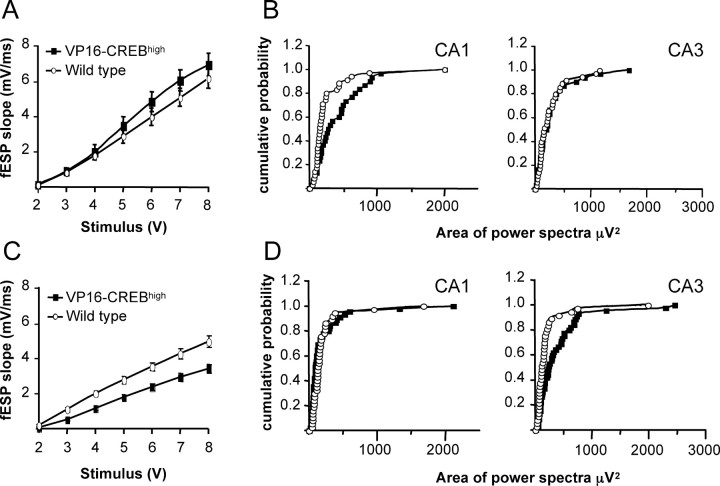
Figure 6.
Increased spontaneous activity in the hippocampal circuit. A, Input/output curve of fEPSP slope (millivolts per milliseconds) versus stimulus at the Schaffer collateral pathway of hippocampal slices from VP16–CREBhigh (n = 31) and wild-type (n = 36) littermates 1 week after induction (p = 0.27). B, Cumulative probability versus area of the power spectra calculated from 250 s recordings at the CA1 (left) and CA3 (right) subfields in the same slices used in A. C, Input/output curve of hippocampal slices from VP16–CREBhigh (n = 45) and wild-type (n = 37) littermates 3 weeks after induction (p < 0.001). D, Cumulative probability versus area of the power spectra calculated from 250 s recordings in the CA1 (left) and CA3 (right) subfields in the same slices used in C. In all cases, transgene expression was turned on when the mice were 4 weeks old.

