
Figure 3.
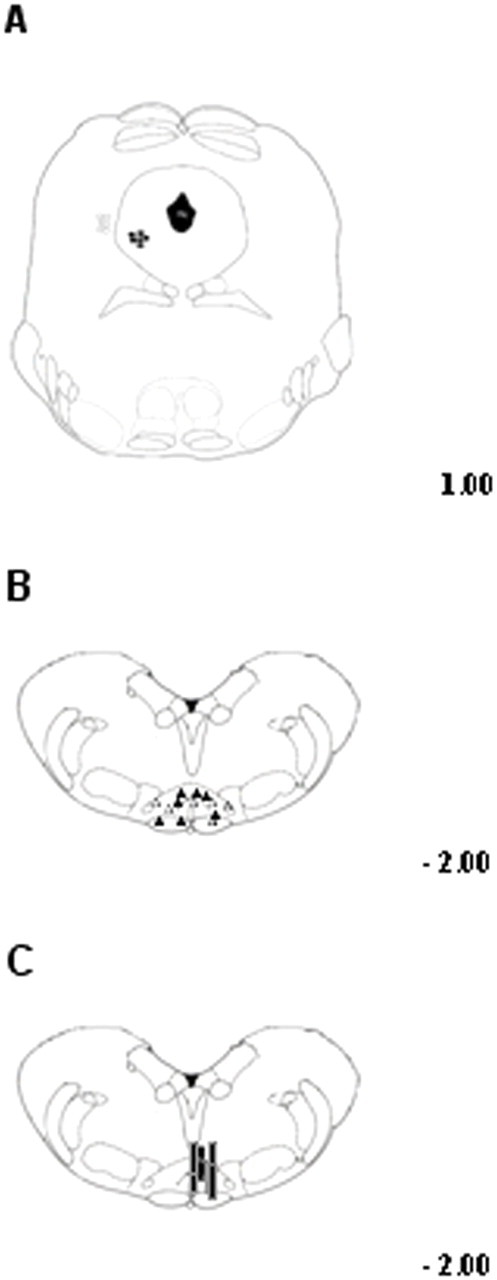
Schematic illustration of the location of PAG microinjection sites (A), RVM ON- or OFF-cell recording sites (B), and RVM microdialysis probes location (C). Vehicle or drug microinjections were performed into the ventrolateral PAG matter (filled circles) (A) while cell recording was performed by lowering a tungsten electrode into the RVM (B). Filled triangles represent ON-cells and open triangles the OFF-cell sites. The location of microdialysis probe (C) was also histologically confirmed and marked as correct (black bars) when the probe tip fell within the RVM areas here studied. Many sites are not shown because of overlap of symbols. Distances from the interaural line are indicated.