

Abstract
Neuronal firing patterns determine the manner of neurosecretion, the underlying mechanisms of which are poorly understood. Using supraoptic nuclei in brain slices from lactating rats, we examined the involvement of extracellular signal-regulated protein kinase 1/2 (ERK1/2) and filamentous actin (F-actin) in burst generation by oxytocin (OT) neurons. Blocking phosphorylation of ERK1/2 (pERK1/2) decreased miniature EPSCs and blocked OT-evoked bursts, as did intracellularly loading an antibody against pERK1/2. OT (10 pm) increased cytosolic pERK1/2 close to the cell membrane within the first 5 min, subsiding by 30 min, whereas OT elicited pERK1/2 nuclear translocation in closely associated supraoptic astrocytes. The increased pERK1/2 was tightly correlated with spatiotemporal actin dynamics. In OT neurons, OT initially increased F-actin, particularly at membrane subcortical areas, and then decreased it after 30 min. Both polymerization and depolymerization of actin cytoskeleton were associated with bursts, but only polymerization facilitated OT-evoked bursts. Blocking ERK1/2 activation blocked OT-evoked actin polymerization, whereas depolymerizing F-actin increased pERK1/2 expression. These changes were further identified in vivo. In intact animals, suckling increased ERK1/2 activation in the cytosol and membrane subcortical area F-actin formation in OT neurons, whereas it increased F-actin concentration in astrocytic somata. Coimmunoprecipitation showed that suckling increased molecular interactions between pERK1/2 and actin. Finally, two different blockers of ERK1/2 kinase injected intracerebroventricularly reduced suckling-evoked milk ejections. This is the first demonstration that OT mediation of suckling-evoked bursts/milk ejections is via interactions between pERK1/2 and actin cytoskeleton.
Keywords: coimmunoprecipitation, electrophysiology, immunocytochemistry, signal transduction, supraoptic nucleus, Western blots
Introduction
Neurons change their firing patterns under different physiological conditions and functional requirements (Faingold, 2004; Krahe and Gabbiani, 2004). Burst firing patterns play crucial roles in nervous system maturation, regulation of rhythmic activity, neurosecretion, and memory formation. Hypothalamic oxytocin (OT) neurons are representative bursting neurons. They are highly compacted in the supraoptic (SON) and paraventricular (PVN) nuclei, and distributions of their dendrites, somata, and axonal terminals can be readily identified (Armstrong, 1995; Hatton, 2004). During lactation, OT neurons display intermittent, synchronous burst discharges, resulting in bolus release of OT from the neurohypophysis and subsequent milk ejections from the mammary glands (Crowley and Armstrong, 1992; Wakerley et al., 1994). The probability of occurrence and intensity of a particular milk ejection depend on the preceding burst and its degree of synchrony. In burst generation, somatodendritically released OT is particularly important. Suckling increases OT concentrations in and around the SON and PVN (Neumann et al., 1994; Bealer and Crowley, 2001). Blocking activation of OT receptors (OTRs) blocked suckling-evoked bursts (Freund-Mercier and Richard, 1984). OT can also evoke bursts in OT neurons in brain slices (Wang and Hatton, 2007) that preserve most features of the in vivo bursts (Wang and Hatton, 2004). These characteristics make OT-evoked in vitro bursts and milk ejections suitable models for studying cellular mechanisms involved in burst generation.
To make the transition from regular firing to a burst, transient signals need to occur in the OT signaling cascade. Phosphorylated extracellular signal-regulated protein kinase 1/2 (pERK1/2) and actin cytoskeleton are strong candidates for burst transition. In the signaling pathway for OT actions, pERK1/2 has been identified (Hoare et al., 1999; Zlatnik et al., 2000; Burns et al., 2001). OTR-associated G-protein βγ subunits, a dominant signal in OT-evoked bursts (Wang and Hatton, 2007), can activate ERK1/2 by phosphorylation to form pERK1/2 (Zhong et al., 2003). Another major target of OT actions is actin. OT can cause actin polymerization in OT neurons (Wang and Hatton, 2006) and its contraction in myoepithelium or myometrium (Gimpl and Fahrenholz, 2001). OT actions on actin are mediated by producing prostaglandins (Wang and Hatton, 2006), a key player in OT-evoked bursts (Hatton and Wang, 2005). The production of prostaglandin also depends on ERK1/2 activation (Zhong et al., 2003; Reversi et al., 2005). Moreover, OTRs are expressed by both SON neurons and astrocytes (Wang and Hatton, 2006), which allows OT to mobilize various cells to actualize the milk-ejection reflex (MER). However, it remains a question in burst generation how pERK1/2 and actin interact among SON neurons and astrocytes.
Using electrophysiology, immunocytochemistry, Western blot, and coimmunoprecipitation, we examined the involvement of pERK1/2 and actin in OT neuronal bursts evoked by OT application in slices or milk ejections induced by suckling in vivo. We show here for the first time that spatiotemporal interactions between ERK1/2 activation and actin dynamics underlie burst generation/milk ejections.
Materials and Methods
All procedures in the animal experiments were in accordance with the guidelines on the use and care of laboratory animals set by National Institutes of Health and approved by the Institutional Animal Care and Use Committee of the University of California, Riverside.
Drugs, antibodies, and agents used.
All drugs were from Sigma (St. Louis, MO) except as otherwise noted. Goat polyclonal antibody against OT–neurophysin (OT–NP), monoclonal mouse antibody against pERK1/2, blocking peptide for pERK1/2 antibody, rabbit polyclonal antibody against glial fibrillary acidic proteins (GFAP), and rabbit total ERK 2 (tERK2) antibody were from Santa Cruz Biotechnology (Santa Cruz, CA). Protein A agarose beads were from Millipore (Charlottesville, VA). Rabbit polyclonal antibody against actin was from Cytoskeleton (Denver, CO). Alexa Fluor 488-, 555-, or 647-labeled donkey anti-goat, anti-rabbit, or anti-mouse antibodies, Latrunculin B, and Alex Fluor 555 or 647-conjugated phalloidin were from Invitrogen (Eugene, OR). All reagents for Western blots were from GE Healthcare (Piscataway, NJ) and Bio-Rad (Hercules, CA).
Electrophysiology.
The brain slice and patch-clamp recording procedures were similar to those described in our previous reports (Wang and Hatton, 2006). Briefly, coronal brain slices, 300 μm thick, containing the SON were obtained from Sprague Dawley (Holtzman strain) lactating rats (postpartum day 8–13). Brains were sliced into oxygenated, ice-cold artificial cerebrospinal fluid (aCSF) and then transferred to an aCSF at room temperature (21–23°C) for at least 1 h before being used for electrical recordings at 35°C. Composition of the aCSF was as follows (in mm): 126 NaCl, 3 KCl, 1.3 MgSO4, 2.4 CaCl2, 1.3 NaH2PO4, 26 NaHCO3, 10 glucose, and 0.2 ascorbic acid, pH 7.4 adjusted with 2 3-[N-morpholino] propanesulfonic acid (filtered and maintained with 95% O2/5% CO2 gas mixture). Whole-cell patch-clamp methods were used to record electrical activity. Patch-pipette filling solution contained the following (in mm): 145 K-gluconate, 10 KCl, 1MgCl2, 10 HEPES, 1 EGTA, 0.01 CaCl2, 2 Mg-ATP, and 0.5 Na2-GTP, pH 7.3, adjusted with KOH. To mark recorded neurons for subsequent immunocytochemical identification, 0.05% Lucifer yellow (K+ salt) was added to the pipette solution. Patch electrodes were visually guided onto SON cells via an upright microscope (Leica DM LFSA; Leica, Nussloch, Germany) equipped with infrared and fluorescence capabilities. Rate of aCSF perfusion was 1.2–1.5 ml/min. Axoclamp 2B and Axopatch 200B amplifiers were used for collecting electrical signals that were filtered and sampled at 5 kHz by Clampex 9 or Clampex 10 software through a 1320 analog-to-digital/digital-to-analog converter (Molecular Devices, Sunnyvale, CA). Data were stored in a computer for off-line analysis.
Immunocytochemistry.
Methods for identification of recorded neurons were adapted from those described previously (Smithson and Hatton, 1990). Briefly, after labeling recorded cells with Lucifer yellow, slices were fixed overnight with 4% paraformaldehyde at 4°C and treated with 0.3% Triton X-100 for 30 min. After incubation with goat polyclonal OT–NP antibody (1:250 to 1:400 dilution) for 4 h at room temperature, a donkey anti-goat antibody (Alexa Fluor 647 labeled, 1:1000) was applied for 1.5 h to label OT neurons. In separate slice experiments used for identification of other antigens, slices were exposed to drugs only, after incubation at room temperature for 2–4 h as described previously (Wang and Hatton, 2007). Slices were treated with various agents, fixed and permeated, and then incubated with primary antibodies at 4°C overnight (mouse anti-pERK1/2, 1:1000) or room temperature for 4 h (goat anti-OT–NP, 1:250 to 1:400; rabbit anti-GFAP, 1:400). Alexa Fluor 488-, 555-, or 647-conjugated donkey anti-mouse, goat, or rabbit antibodies (1:1000) were applied and matched to corresponding primary antibodies. To identify filamentous actin (F-actin), Alexa Fluor 555- or 647-conjugated phalloidin (1:100) was applied for 30 min after other secondary antibodies. Finally, Hoechst (4′,6′-diamidino-2-phenylindole, 1:1000 for 30 min) was added to label the nuclei in all samples. Sections were examined with a laser scanning confocal microscope (Leica TCP SP2) in sequential scanning mode and Z-series sectioned (0.5 or 1 μm thick for each section).
For observing the direct influence of suckling on pERK1/2 expression and F-actin formation, lactating rats were separated from all pups for 4 h, after which they were divided into the following three groups: nonsuckling, suckling before MER (5–10 min), and suckling immediately after the third or fourth milk ejections. Animals were decapitated, and the brains were quickly dissected out and immersed in ice-cold aCSF within 30 s, to stop metabolic activity, before being fixed in 4% paraformaldehyde for 3 d at 4°C. Brains were then cut into 40-μm-thick sections and subjected to immunostaining with the same procedure as described above.
Western blots and coimmunoprecipitation.
Samples were from either slices or intact animals, as described previously (Wang and Hatton, 2007). Animals were decapitated, and the SONs were dissected out. To reduce the variability of results from different slices, similar sized punches of SONs were trimmed and assigned to different groups. The SON was put in the cold lysis buffer and prepared for Western blotting or immunoprecipitation experiments. Different proteins in the samples (40 μg each) from lysed slices were separated on 10% SDS polyacrylamide gels. Protein was transferred onto nitrocellulose membranes at 4°C. Membranes were pretreated with 5% milk solids for 1 h at room temperature and then incubated with antibodies against pERK1/2 (mouse, 1:1000, overnight at 4°C) or rabbit tERK2 (1:1000, 1 h at room temperature) separately. Bands were visualized using horseradish peroxidase-conjugated secondary antibodies and an enhanced chemiluminescence system and calibrated with tERK2 bands.
For coimmunoprecipitation, total lysates were precleared with protein A agarose to reduce nonspecific binding of proteins to the agarose beads when used later in the assay. Slice lysates (1000–1500 μg per 500 μl) were added to 1.5 μg of immunoprecipitating antibody (rabbit tERK2) to form an immunocomplex. After overnight incubation at 4°C on an orbital shaker, the immunocomplexes were captured by adding 50 μl of protein A agarose bead slurry and gently rocking for 2 h at 4°C. The agarose beads were collected by a pulse centrifugation (i.e., 10 s in the microcentrifuge at 13,000 rpm). After discarding the supernatant and washing the beads three times with 800 μl of ice-cold buffer, the agarose beads were resuspended in 50 μl of 2× sample buffer and mixed gently. Beads were boiled for 10 min to dissociate the immunocomplex from the beads. The beads were collected by centrifugation, and the supernatant was run on 10% SDS polyacrylamide gel. Protein was then processed and transferred to the membranes as in Western blots. The protein-loading membrane was then incubated with antibodies against actin (rabbit, 1:300), tERK2, for 4 h at room temperature with necessary stripping of membranes and reprobes.
Microinjection of drugs into the third ventricle.
Sprague Dawley rats (300–400 g), lactating for 10–12 d, were used for this experiment. The mother was separated from a litter of 10 pups until suckling effects were tested 4 h later. The mother was anesthetized with urethane (1.1–1.25 g/kg body weight, i.p.). Lidocaine (1%) was injected subcutaneously at all points of surgery to minimize pain and discomfort. The rat was fixed in the prone position on a stereotaxic frame, and the skull was exposed. A stainless steel guide cannula (made from a 23 gauge needle) was placed in the third ventricle (0.4 mm posterior to bregma, lateral 0 mm from midline, 8.0 mm ventral to the skull surface, with an angle of 5° from the vertical, pointing ventroposteriorly) according to the atlas of Paxinos and Watson (1986). The probes were secured in place with dental cement and two stainless steel skull screws. A tight-fitting stylet was kept inside the guide cannula to prevent occlusion. For intracerebroventricular injection, a modified 27 gauge stainless steel injector was advanced into the guide cannula and extended 2 mm past the end of the guide cannula into the third ventricle. Correct locations were confirmed by outflow of CSFs during cannulation. A 10 μl Hamilton syringe connected by polyethylene tubing to the injector was used for drug delivery. Drugs were administered at 0.1 μl/min for 10 min, and the injector was left in place for 20 min after completion of injections. PD98059 [2-(2-amino-3-methoxyphenyl)-4H-1-benzopyran-4-one] or U0126 [1,4-diamino-2,3-dicyano-1,4-bis(o-aminophenylmercapto) butadiene], blockers of ERK1/2 kinase [i.e., mitogen-activated protein kinase kinase (MEK)], were dissolved in 50% dimethylsulfoxide (DMSO) and 50% aCSF. Number of milk ejections and litter body weight gains were recorded for evaluation the MER. In two rats, cannulas were also placed into the right atrium through the jugular vein for delivering OT and testing behavioral stretch reaction of the pups at the beginning and end of suckling. In one of the two rats, intramammary pressure was measured through an intramammary cannula and a pressure transducer (Harvard Apparatus, Holliston, MA). Rats were killed by an overdose of Nembutal (100 mg/kg body weight) after experiments. To verify correct location in the third ventricle, 2.5% Pontamine Sky Blue (2 μl) was injected through the ventricular cannula at the end of experiment; dye staining of the ventricle was confirmed visually.
Data collection and analysis.
Electrophysiological data were collected after firing rate and membrane potential became stable in whole-cell configuration, which usually took 10–20 min. The following criteria, definitions of terms, and identifying conditions were used. Identification of OT and VP neurons was done as in our previous work (Wang and Hatton, 2006). To qualify as in vitro bursts, the electrical activity was required to show all electrophysiological features of the milk-ejection burst (Wakerley et al., 1994) with spike features of bursts evoked by the α1 adrenoceptor agonist phenylephrine (Wang and Hatton, 2004). In brief, acceptable bursts were required to have the following characteristics: a sudden increase in firing rate (at least five times the average basal firing rate) and in spike duration, accompanied by transient depolarization of membrane potential and reduction in spike amplitude as the peak rate of firing (instantaneous frequency 10 times the basal firing rate), was reached, all followed by an exponential decay in firing rate after the peak rate, and ending with a period of silence. Measured liquid junction potentials of −8 to −11 mV (potential of pipette solution with respect to the bath) were uncorrected in Results.
In quantifying the relative intensities of various immunostained elements, the luminosity of the cells in a specific channel in each section was assayed with Leica LCS Lite software. The background level during scanning was set to those of “no-primary antibody” controls and, while measuring the intensity, “Minimum Baseline Correction” for all the channels was applied, i.e., the minimum value of the intensity distribution is selected and defined as zero level. In image analysis, a single optical section was taken. For most cells, these optical sections were through the middle of the cell and its nucleus, selected from among many sections in a Z-series scan. A value for each section/slice was obtained by averaging values from six to eight cells or as indicated otherwise. In the same series of experiments, depth of focus, photo multiplier tube intensity (350–600 V), offset (1–4%), pinhole size (1 airy unit corresponding to an optical slice thickness of 300 nm), magnification (63× objective lens), and zoom were kept at the same value. Groups for comparison were scanned in the same experiment. For intensity of immunostaining, the term “strong” means that the image intensity falls in the top one-third of the detectable range (e.g., 1–256); “weak” was used for those falling in the bottom one-third of the range. Overlaps of different channels and nucleus morphology were confirmed by Z-series scanning. Control experiments to exclude nonspecific staining included pretreatment of the slices with a blocking peptide before applying pERK1/2 antibody and application of secondary antibody without pERK1/2 antibody (no primary control). Both procedures led to the absence of staining for pERK1/2.
The criteria for evaluating F-actin structures in membrane subcortical areas (i.e., cytosolic areas within of the neuronal diameter from the membrane) were as follows. Three equidistantly spaced horizontal and three vertical optical sections, through the same neuron, were scanned and measured with Leica LCS Lite software. Neurons having intact membrane subcortical F-actin networks (or F-actin ring) had two peaks, in grayscale, at each horizontal/vertical intersection, that was at the periphery of the neuron. This feature had to be consistent through at least three sections in Z-series scanning. Neurons exhibiting only one peak or no peak in any of the six measurements were considered to lack intact membrane subcortical F-actin networks. In determining cell apposition, intercellular space or the membrane F-actin thickness had to be <1 μm and continuously aligned for at least 10 μm or of the length of cellular circumference. For measurement of pERK1/2 at membrane subcortical areas, six equally distanced points/areas along the circumference of a neuron were tested and averaged. Individual values were based on averages of six to eight neurons from each section. Similarly, cytosolic F-actin or pERK1/2 expression was determined by these averages. To evaluate nuclear F-actin or pERK1/2, the whole nucleus of each individual neuron was selected and measured, and then these were averaged for one section.
To overcome the difficulties involved in using only GFAP to identify astrocytic somata, we combined the nuclear features of SON astrocytes with GFAP staining. Images with a small homogeneous, round- or elliptical-shaped nuclei (Paterson and Leblond, 1977) in line with GFAP-positive fibers, but not overlapping with magnocellular neurons in Z-series sections, were defined as astrocytic somata. This represents at least 95% of astrocytes because alleged interneurons in the SON are not more than 5% (Armstrong, 1995). In addition, nuclei of endothelial cells in the SON could be readily identified by their association with blood vessels under confocal microscopy.
ANOVA, paired or nonpaired t test, or Wilcoxon's rank test and χ2 test were used for statistical analyses when appropriate as instructed by SigmaStat program (SPSS, Chicago, IL), and p < 0.05 was considered significant. All measures were expressed as mean ± SEM, except as otherwise indicated in Results.
Results
The role of pERK1/2 and F-actin in OT-evoked bursts was first examined by patch-clamp recordings in 104 putative OT neurons and in 32 neurons identified immunocytochemically as being OTergic and approximately equally distributed among the various groups. Additionally, miniature EPSCs (mEPSCs) were analyzed in five SON neurons. Effects of suckling on the expression of pERK1/2 and F-actin in confocal images and Western blots were observed in 32 animals. Finally, effects of blocking ERK1/2 activation in suckling rats on the MER were further examined in nine lactating rats.
ERK1/2 activation and OT-evoked bursts
OT is essential for burst generation by OT neurons in intact animals (Freund-Mercier and Richard, 1982) and in slices (Wang and Hatton, 2007). Similar to our previous results (Wang and Hatton, 2007), bath application of 10 pm OT for 30 min in normal aCSF evoked bursts in 25% (6 of 24) of OT neurons (Fig. 1A). The bursts occurred after a delay of 9–25 min. Together, these findings indicate that OT, acting on local neural circuits, has burst-evoking capability.
Figure 1.

Effects of OT on the electrical activity of SON OT neurons. A and B show examples of effects of OT on firing activity in patch-clamp recordings in the absence (A) and presence (B) of PD98059 (10 μm), a blocker of ERK1/2 activation. A1, A2, Before and after application of OT. Note that a typical burst was observed at 10 pm OT concentration, 14 min after starting OT application. A3, Immunocytochemical identification of OT neurons: Lucifer yellow (LY, left), Alexa Fluor 647-labeled OT neurophysin (OT–NP, middle), and their merged channel (Merge, right, brighter). B, Effects of blocking ERK1/2 activation on basal (B1) and burst (B2) firing, respectively. B1, Recordings of firing episodes in the presence of PD98059 show that OT did not evoke bursts, although it did increase basal firing activity. Dashed line indicates the pretreatment membrane potential (bottom left). B2, Example of the effects of OT on burst firing in the presence of PD98059. The preburst firing (arrowhead in left episode) was not observed after blocking ERK1/2 activation, and OT failed to evoked bursts. B3, Summary graphs show the effects of OT on firing activity and spike features in the presence of PD98059. C, Effect of U0126 (10 μm) on miniature EPSCs and OT (10 pm) actions in the presence of 0.5 μm TTX and 20 μm bicuculline. C1, Exemplary whole voltage-clamp recordings at holding potential (Vh) of −70 mV. The broken line represents an elapsed time of 30 min. C2, Each trace represents episodic recordings from individual neurons. C3, Summary graphs showing effect of U0126 on the frequency and amplitude of miniature EPSCs and on OT actions. Em, Membrane potential; Spk, spike; Amp., amplitude; Freq., frequency. *p < 0.05 compared with control.
As stated previously, pERK1/2 likely plays a key role in OT-evoked bursts in OT neurons. However, our preliminary results (Hatton and Wang, 2005) that blocking ERK1/2 activation also blocked OT-evoked bursts need confirmation. To verify this finding, we examined the effects of blocking ERK1/2 activation on OT-evoked bursts in slices. Bath application of 10 μm PD98059 (Alessi et al., 1995) or U0126 (Davies et al., 2000) for 10 min to block the activation of MEK significantly reduced the basal firing rate in 19 of 22 OT neurons. OT failed to evoke bursts in any of these neurons in the presence of PD98059 or U0126 (Fig. 1B), although in two of these neurons, OT alone had previously evoked bursts. Similarly, intracellular loading of a pERK1/2 antibody (1 μg/ml; n = 18), but not its blocking peptide, eliminated OT-evoked burst generation. Two of six cells showed bursts in the presence of this blocking peptide. Collectively, when pERK1/2 signaling was blocked, 0 of 40 OT neurons emitted bursts. This result differs significantly (p < 0.01 by χ2 test) from the burst incidence in the OT-only group. In contrast to the postsynaptic effect, blocking ERK1/2 activation with U0126 (10 μm, 10 min) significantly (n = 5; p < 0.05) reduced the frequency and amplitude of mEPSCs in the presence of 0.5 μm TTX and 20 μm bicuculline (Fig. 1C). In the presence of U0126, OT did not evoke EPSC clustering that had been shown in our previous work (Wang and Hatton, 2007). The depressive effect of blocking ERK1/2 activation may be related to the inhibitory effect of OT on EPSCs at presynaptic terminals (Pittman et al., 2000), whereas inhibitory effects of intracellular pERK1/2 antibody indicate a direct postsynaptic action.
OT-evoked ERK1/2 activation
The suppressive effects of blocking ERK1/2 activation on OT-evoked bursts highlight the importance of pERK1/2 in burst generation. Here, we provide immunocytochemical evidence for OT-evoked expression of pERK1/2 (Fig. 2). Ten picomolar OT was bath applied to slices for 0, 5, and 30 min, and pERK1/2 was detected with immunostaining and confocal microscopy. Each treatment used two SON-containing slices and was repeated four times. Before application of OT, weak and scattered pERK1/2 spots were seen in OT neurons, and moderate to strong staining was shown in some fiber- or terminal-like components (Fig. 2A1, top row). Application of OT for 5 min significantly increased the expression of pERK1/2 over 0 min controls (Fig. 2A1, middle row). Thirty minutes after application of OT, pERK1/2 staining in OT neurons became diffuse, and its intensity in cytosolic areas of OT neurons was significantly reduced, whereas nuclear translocation of pERK1/2 in non-magnocellular cells was clearly visible, likely displayed by astrocytic somata (Fig. 2A1, bottom row). These changes are summarized in Figure 2A2.
Figure 2.
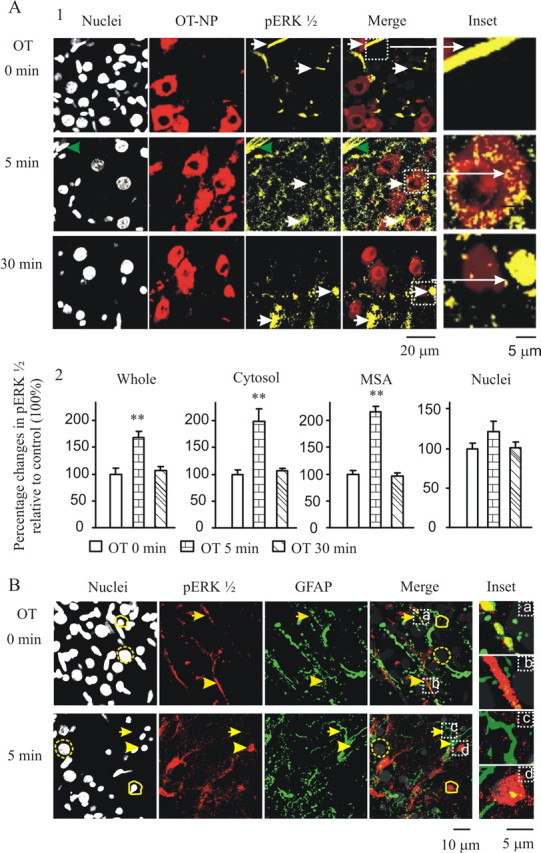
Effect of OT on the expression of pERK1/2. A, Expression of pERK1/2 in OT neurons at 0, 5, and 30 min of 10 pm OT treatment in confocal images. A1, Columns from left to right show nuclei (in gray), OT–NP (in red), pERK1/2 (in yellow), their merges, and insets. Arrows in the top row point to OT–NP-negative neuropil that showed moderate to strong pERK1/2 staining. Arrows in the middle row indicate cytosolic localization of pERK1/2 in OT–NP-positive somata, which was outside of magnocellular nuclei and in cytosolic sites. Green arrowheads in the top left corners of columns 1, 3, and 4 show activation of ERK1/2 at a blood vessel. Arrows in the bottom row show localization of pERK1/2 in putative astrocytic nuclei. The insets at the right are the enlargements of those in the merged channel. A2, Summary graphs showing relative intensity of pERK1/2 in the whole section, cytosol, membrane subcortical area (MSA), and nuclei. **p < 0.01 compared with control in paired t test based on eight SONs. B, Staining in astrocytes: nuclei, pERK1/2, GFAP, and their merge (from left to right). Yellow dashed circles, Nuclei of magnocellular neurons; yellow solid line circles, putative nuclei of astrocytes. Arrows in the top row, Positive pERK1/2 staining with GFAP-positive neuropil (a); arrowheads, positive pERK1/2 staining with GFAP negative neuropil (b) and their corresponding loci in the other channels. Arrows in the bottom row, GFAP-positive but pERK1/2-negative neuropil (c); arrowheads, GFAP surrounded, pERK1/2-positive astrocytic nucleus (d). The insets (a–d) at the right are enlargements of those in the merged channel. For other annotations, refer to Figure 1.
To reveal the location of pERK1/2 expression in the non-magnocellular cells, we double stained for GFAP and pERK1/2, focusing on the ventral glial lamina in which few or no OT neurons exist. Under control conditions, GFAP-positive and -negative fibers or terminals (neuropil) showed moderate to strong pERK1/2 staining (Fig. 2B, top row). After 5 min OT treatment, most staining in the neuropil weakened, whereas strong staining appeared in and around astrocytic nuclei (Fig. 2B, bottom row). The reduction of pERK1/2 in non-astrocytic presynaptic terminals is consistent with the inhibitory effect of OT on presynaptic currents (Pittman et al., 2000). This result suggests that OT may reduce mEPSCs by inhibition of presynaptic pERK1/2 expression. It is noteworthy that only 80–90% of the OT neurons and 60–70% astrocytic somata increased expression (>20% of averaged control level) of pERK1/2 in the cytosol with large variation among cells, reflecting biological diversity. In addition, ERK1/2 in many non-OTergic magnocellular neurons was also activated (data not shown). These results indicate functional diversity among SON cells.
OT-evoked bursts and actin dynamics
ERK1/2 activation and actin dynamics appear to be closely related in OT-evoked bursts. Translocation of pERK1/2 could not be accomplished without the participation of actin dynamics. To investigate the involvement of F-actin, we examined actin dynamics in relation to OT-evoked bursts. Application of 10 pm OT for 5 and 30 min in slices caused dramatic changes in the expression and distribution of F-actin from the control. After OT stimulation for 5 min, F-actin tended to form ring-like structures around OT–NP components (Fig. 3A1, middle row), suggesting membrane subcortical localization. However, 30 min after OT treatment, the F-actin structures broke down in OT neurons and the subcortical rings disappeared. This was accompanied by a global reduction of F-actin in the SON but leaving pronounced F-actin condensation in the putative astrocytic somata (Fig. 3A1, bottom row). These changes are summarized in Figure 3A2.
Figure 3.
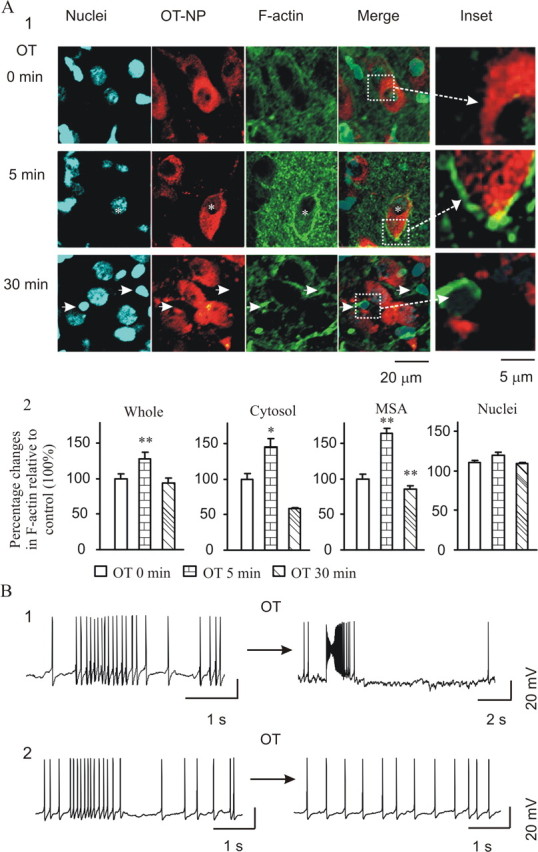
Actin dynamics during OT stimulation and their relationship to OT-evoked bursts. A, Actin dynamics in response to OT stimulation in OT neurons at 0, 5, and 30 min. A1, Columns from left to right show nuclei, OT–NP, F-actin, and their merges. Asterisks in the middle row identify a cell showing membrane subcortical aggregation of reorganization of F-actin that formed ring-like structures surrounding OT–NP components. Arrows in the bottom row indicate accumulation of F-actin around putative astrocytic nuclei. In the inset column are enlargements of merge channel images. A2, Summary graphs showing relative intensity of F-actin in the whole section, cytosol, membrane subcortical area (MSA), and nuclei in eight SONs. B, Effects of polymerized or depolymerized F-actin cytoskeleton on OT-evoked bursts. B1, Intracellularly loading phalloidin (33 nm) to stabilize F-actin caused the burst (left); addition of OT triggered strong bursts (right). B2, Disrupting F-actin cytoskeleton with bath-applied cytochalasin B (CB; 10 μm, 10 min) triggered burst-like firing during the first 2–5 min (left) without marked spike amplitude reduction. At the end of cytochalasin B treatment (right), the neuron became silent and no bursts could be evoked by OT. *p < 0.05. For other annotations, refer to Figure 2.
To seek direct evidence for F-actin involvement in burst generation/milk ejections, we tested the influence of actin dynamics on OT-evoked bursts. Intracellular loading of phalloidin (33 nm; n = 15), an actin stabilizing agent, triggered frequent bursts (10 bursts from 6 neurons) within 10–20 min of obtaining whole-cell configuration. Addition of OT (n = 9) triggered bursts (seven bursts from four neurons) with increased amplitude and marked spike changes (Fig. 3B1), suggesting facilitation of bursts by stabilization of F-actin. However, bath application of the cytoskeleton-disrupting agent cytochalasin B (10 μm, 10 min; n = 20) could also trigger burst-like firing (five bursts from four neurons), although these occurred only at the initial period. This burst-like firing showed no or weak reduction in the spike amplitude around peak rate firing (Fig. 3B2). This is opposite to phalloidin-evoked bursts. Addition of OT (n = 20) after cytochalasin B treatment did not trigger bursts. In light of possible nonspecific actions of cytochalasin B on F-actin, we also tested effects of bath application of latrunculin B on OT neuronal activity. Similar to the effect of cytochalasin B, latrunculin B (1 μg/μl) triggered bursts in one of six OT neurons, whereas the excitatory effect of OT was blocked. Intracellularly loaded latrunculin B or cytochalasin B also blocked the excitatory effects of OT (n = 8), suggesting involvement of postsynaptic F-actin. Altogether, among 34 neurons tested, none showed bursts in response to OT stimulation. This is significantly different (p < 0.01 by χ2 test) from the OT-only group. These results indicate that F-actin is involved in modulating firing patterns.
Interactions between pERK1/2 and actin dynamics
Both actin dynamics and pERK1/2 expression were associated with OT-evoked bursts. However, the relationship between the two molecules in OT neurons remains unknown. Additional experiments investigated this relationship. Multiple immunostaining showed that OT-evoked F-actin ring formation was highly colocalized with pERK1/2 distribution surrounding OT–NP components in a three-dimensional view, which was particularly dramatic at the membrane subcortical areas (Fig. 4A). Treatment of slices (n = 6) with 10 μm PD98059 for 30 min before application of OT disrupted most F-actin in OT neurons (69.3 ± 13.3% of control, p < 0.05) but reduced pERK1/2 expression (68.7 ± 8.4% of control, p < 0.01). Addition of OT partially restored membrane subcortical F-actin (109.6 ± 6.2% of control, p > 0.05) and the pERK1/2 (107.6 ± 12.7% of control, p > 0.05) but did not lead to formation of intact ring-like structures, suggesting that ERK1/2 activation at least partially mediated the formation of F-actin rings (Fig. 4B). Conversely, depolymerizing F-actin facilitated pERK1/2 formation (Fig. 4C). Pretreatment of slices (n = 6) with cytochalasin B (10 μm, 30 min) markedly reduced F-actin levels (61.0 ± 9.1% of control, p < 0.01). However, F-actin ring disruption was not observed after 10 min of this treatment. The remaining F-actin tended to form a broken ring around OT–NP components, and many puncta were dispersed over the SON parenchyma. Puzzlingly, pERK1/2 increased significantly (134 ± 21% of that in control, p < 0.05) across cytosolic sites in response to cytochalasin B, mostly limited to magnocellular neurons. After cytochalasin B treatment, OT (10 pm, 5 min) failed to cause patterned pERK1/2 expression in OT neuronal cytosol. Consistent with these morphological changes, cytochalasin B treatment also increased pERK1/2 protein (133 ± 8.8% of that in control, p < 0.05, n = 4) in Western blots, whereas it eliminated OT-evoked pERK1/2 expression (103 ± 12.9% of that in control, p > 0.05, n = 4) (Fig. 4D). These results suggest that F-actin may suppress basal ERK1/2 activation, whereas it guides pERK1/2 translocation and facilitates OT-evoked ERK1/2 activation.
Figure 4.

Interactions between F-actin and pERK1/2. A–C, Immunostaining of nuclei (except A), OT–NP, pERK1/2, F-actin, and their merges in confocal images. A, Effect of OT on pERK1/2 expression and actin dynamics in a three-dimensional view. Images at 0, 5, and 10 min of OT (10 pm) application. Arrows in the top row (control) show that OT–NP was mixed with broken thick F-actin walls (column 4) and randomly overlapped with pERK1/2 (column 5). Arrows in the middle row (5 min OT) show that OT–NP was surrounded by thin F-actin walls or shells. This occurred between neighboring OT neurons and appeared as cellular appositions. Parts of the OT–NP were also mixed with pERK1/2 at the membrane subcortical areas. Arrows in the bottom row (30 min OT) indicate that most OT–NPs were not surrounded by F-actin puncta; pERK1/2 became diffusely mixed with OT–NP and F-actin. The insets (long dashed white arrows) are enlargements of the enclosed images in the merge channel. B, Effect of blocking ERK1/2 kinase activation on actin dynamics. Images were taken at OT 0 min, OT 5 min, PD98059 (10 μm, 30 min), and PD98059 plus OT 5 min (top to bottom). C, Effects of disrupting F-actin with cytochalasin B (CB) on pERK1/2 expression and actin dynamics. Images were taken at control, OT 5 min, CB (10 μm, 30 min), and CB plus OT 5 min (from top to bottom). D, Effect of disrupting F-actin with CB on pERK1/2 protein expression. Top row, pERK1/2; bottom row, tERK2. From left to right are the bands of OT for 0 and 5 min, OT for 0 and 5 min in the presence of CB starting 30 min before OT, respectively. For other annotations, refer to Figure 2.
Suckling-evoked ERK1/2 activation and actin dynamics
Our in vitro observations showed that OT could both activate ERK1/2 and cause dynamic changes in actin cytoskeleton. To acquire evidence in support of their functions in vivo, we examined pERK1/2 expression and F-actin distribution in lactating rats (n = 12) during suckling. In nonsuckled rats, pERK1/2 expression was weak, diffusely distributed in the cytosol of magnocellular neurons, and barely visible above the background level in their nuclei (Fig. 5A,B). Suckling stimuli significantly increased pERK1/2 intensity in the cytosol and nuclei in OT neurons before the occurrence of the first milk ejection. Immediately after occurrence of the third or fourth milk ejection, pERK1/2 expression tended to be reduced in the neurons, although it was still higher than before suckling. Interestingly, the ratio of special cytosolic pERK1/2 to general cytosolic and nuclear pERK1/2 distribution (set as 1) increased gradually from nonsuckling (1.4) to suckling (1.7) to immediately after the milk ejections (2.1). The ratio after the milk ejections is significantly higher than that of nonsuckling (p < 0.05, n = 8). Accompanying the changes in OT neurons, pERK1/2 levels in adjacent non-magnocellular cells also increased during suckling and appeared to be translocated into putative astrocytic nuclei and/or somata and their proximal projections after milk ejections.
Figure 5.

Suckling activated pERK1/2 and caused reorganization of F-actin in the SON. A, Confocal images of nuclei, pERK1/2, OT–NP, and F-actin for nonsuckling (NS, top row), suckling (S, middle row) before the first MER, and suckling immediately after the MER (bottom row). Arrowheads indicate neuropil in second column and its corresponding location in other columns. Arrows show several putative astrocytic nuclei and their corresponding sites in other columns. Single asterisks indicate a neuron with whole-cell pERK1/2 expression and cytosolic F-actin staining; double asterisks indicate a neuron with cytosolic pERK1/2 and membrane subcortical area F-actin expression. B, Merges of different columns from A. C, Summary graphs showing relative intensity of pERK1/2 in the whole section, cytosol, membrane subcortical area (MSA), and nuclei. D, Summary graphs showing relative intensity of F-actin in the whole section, cytosol, membrane subcortical area (MSA), and nuclei. Other annotations are the same as Figures 2–4.
Accompanying the changes in pERK1/2, F-actin also redistributed spatiotemporally (Fig. 5A,B). In nonsuckling rats, most F-actin was diffusely distributed in the cytosol and intercellular space, and most adjacent OT neurons were separated from one another by thick accumulations of F-actin between cells. Suckling for 5–10 min (before the occurrence of the first milk ejection) increased F-actin formation in the cytosol of OT neurons and putative astrocytic somata, whereas the F-actin between OT neurons, likely in astrocytic processes and synaptic terminals, reduced. F-actin at membrane subcortical areas formed a sharp ring-like structure with thinner membrane F-actin staining in the plane across the central section of OT neurons. Immediately after the occurrence of a milk ejection, total intensity of F-actin staining in the whole SON was reduced, particularly the cytosolic F-actin, whereas membrane subcortical F-actin became clearer. There were higher ratios of cellular apposition against ring-like structures surrounding OT–NP components. As a result, the ratio of adjacent paired neurons with thinner (≤1.0 μm) F-actin walls (cellular apposition) against the pairs with thicker (>1.0 μm, 1.0–5.0 μm, set as 1) F-actin walls increased from nonsuckling (0.41) to suckling (0.68) to MER (0.7). This result suggests that an increased retraction of glial processes from interstitial spaces of magnocellular neurons (Hatton and Tweedle, 1982) may account for the increased cellular apposition. A summary of the effects of suckling on pERK1/2 expression and actin dynamics is shown in Figure 5, C and D.
Suckling-increased pERK1/2 protein and its interaction with F-actin
Consistent with morphological changes in pERK1/2 distribution, suckling also changed pERK1/2 protein expression as shown in Western blots (Fig. 6A). Suckling stimulation significantly increased pERK1/2 expression, but immediately after milk ejections, pERK1/2 levels showed a trend toward decreasing (0.05 < p < 0.1) from those before the milk ejections. Interestingly, pERK1/2 expression is closely associated with actin during suckling. Data presented in Figure 6B show that suckling increased coimmunoprecipitation of total ERK2 and actin. In two sets of experiments in which measurements were made immediately after the MER, the actin pulled down with tERK2 increased to 168 and 201% of nonsuckling control (100%).
Figure 6.
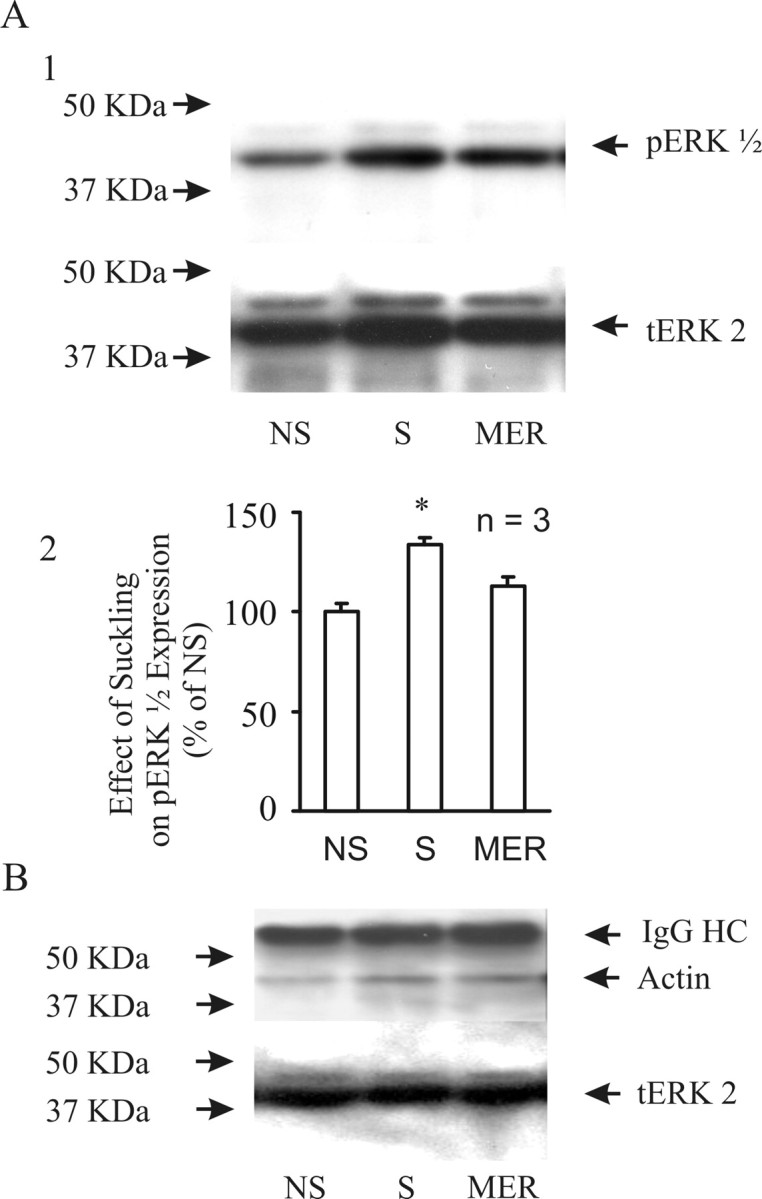
Effects of suckling on the expression of pERK1/2 and the molecular association between ERK and actin. A, Western blot data showing pERK1/2 expression in the SON at different stages of the MER. A1, Examples of pERK1/2 compared with tERK2. A2, Bar graph summarizing event-associated pERK1/2 expression. Number in the graph indicates numbers of rats tested. B, Effect of suckling on the molecular association between ERK and actin. The image shows an increased association of immunoprecipitated tERK2 (bottom bands) with actin (middle bands, detected in Western blots) during suckling stimulation. The top bands are the heavy chain (HC) of immunoprecipitating IgG. For other annotations, refer to Figures 4 and 5.
Blocking ERK1/2 activation suppresses the MER
Both suckling and OT stimulation caused ERK1/2 activation; blocking it also blocked OT-evoked bursts. If suckling-evoked ERK1/2 activation is causally related to burst generation/milk ejections, then blocking ERK1/2 activation should also suppress the MER. To test this hypothesis, we first investigated the effects of intracerebroventricular microinjections of PD98059 (n = 3) or U0126 (n = 3) on the MER. Here we preferred the cerebroventricular injection rather than bilateral intra-SON injection because the former is an efficient approach to modulate burst activity by OT/OTR antagonist (Freund-Mercier and Richard, 1981, 1984) and can minimize physical damage to the SON for normal MER. In addition, this approach includes blockade in PVN neurons, thereby avoiding compensatory influences of intact PVN OT neurons after blocking ERK1/2 activation in the SON only.
Before applying PD98059 or U0126, a vehicle injection (1 μl of 50% DMSO plus 50% aCSF) was tested in these rats. Milk ejections, as indicated by simultaneously stretching responses of the pups, were consistently observed 30–60 min after control injections. The first milk ejection occurred within 10–23 min after suckling initiation (10 pups), and two to five milk ejections were observed for each lactating dam within 30 min. Thirty minutes after vehicle-suckling tests, PD98059 or U0126 (10 mm, in 1 μl of 50% DMSO plus 50% aCSF) was injected into the third ventricle, and suckling was begun again during 30–60 min after this injection. Over 30 min, only one to three weak milk ejections were observed in the three rats treated with PD98059, and no milk ejections were seen in the three U0126-injected rats. Statistically, blocking pERK1/2 activation reduced the frequency of milk ejections significantly (3.6 ± 0.3 in control vs. 1.0 ± 0.5 in blockade, n = 6, p < 0.01). Supporting the visual observations of suckling behaviors, the average gains in litter body weight were reduced significantly (5.6 ± 0.3 in control vs. 0.2 ± 0.3 in blockade, n = 6, p < 0.01) after blocking ERK1/2 activation. As expected, the same dose of U0126 acted more rapidly and potently than PD098059, probably because U0126 has ∼100-fold higher affinity for MEK than does PD098059 (Favata et al., 1998).
To avoid misinterpretation of PD98059 or U0126 effects because of changes in anesthetic levels over the observation period, we also performed a time-locked control experiment. In one rat, a second vehicle injection was applied 30 min after removal of the pups in the first vehicle test. In this case, reexposure to the pups during 30–60 min after the second injection still induced the MER, similar to the first test in the frequency and intensity of pup stretches. This result indicates that neither the vehicle nor the 2–3 h time difference between tests affected the MER. In another rat, intramammary pressure changes were directly observed to validate the results of behavioral observations (Fig. 7A). Suckling caused intermittent increases in the intramammary pressure as described previously. Injection of U0126 (1 mm, in 1 μl) gradually reduced the magnitude of intramammary pressure increases within 10–15 min before stopping them altogether. Vehicle injections produced no changes. After an 8 h recovery interval, milk ejections were again observed, and these were suppressed by a second injection of U0126 (10 mm, in 1 μl). These results support the key position of endogenous pERK1/2 in suckling-evoked milk ejections/bursts.
Figure 7.

Effect of blocking activation of ERK1/2 on the MER. A, Intramammary pressure (IMP) changes in response to intracerebroventricular injection of vehicle (Veh) or U0126 solution during suckling. The top trace shows that vehicle (1 μl of 50% DMSO–50% aCSF) injection did not influence the intramammary pressure transients during milk ejections, whereas 1 mm U0126 (1 μl) resulted in total depression of transient increases in intramammary pressure after a 10–15 min delay. However, injection of 1 mU of OT (intravenous) still caused the intramammary pressure change. Responses to suckling returned after an 8 h recovery interval (right trace). Bottom trace shows that injection of 10 mm U0126 (1 μl) again led to the suppression of intramammary pressure changes during suckling. B, Effects of MEK inhibitor on the expression of pERK1/2 and F-actin in and around OT–NP-positive cells in the SON during suckling in urethane-anesthetized lactating rats. From left to right, images are two representative sections (top and bottom rows) from vehicle only, vehicle plus suckling, and PD98059 plus suckling, respectively. Immunostaining is for OT–NP, pERK1/2, and F-actin in each condition. The relative pERK1/2 intensities (in undefined luminosity units) were 35, 48, and 22 for the vehicle, vehicle plus suckling, and PD98059 plus suckling, respectively. The relative F-actin intensities for the three different conditions were 53, 66, and 49, respectively. NS, Nonsuckling; S, suckling.
Finally, we compared immunostaining of pERK1/2 and F-actin between vehicle-only, vehicle plus suckling, and PD98059 plus suckling in three rats to verify in one experiment the conclusions reported from the above studies. The results showed that application of PD98059 blocked not only the increases in pERK1/2 expression but also reduced increases in cytosolic F-actin and blocked the formation of membrane subcortical F-actin rings. Exemplary images are shown in Figure 7B. Together with the other data in this study, we conclude that pERK1/2 elicitation of actin dynamics during suckling plays a crucial role in OT neuronal burst generation and the MER.
Discussion
In response to suckling or OT stimulation, pERK1/2 expression first increased and then decreased, accompanied by F-actin reorganization. Translocation of pERK1/2 is guided by new F-actin, which restrains basal levels of pERK1/2 and mediates OT-evoked ERK1/2 activation. This study provides the first evidence that OT mediates suckling-evoked bursts/milk ejections by increasing interactions between pERK1/2 and actin dynamics.
ERK1/2 activation and OT-evoked bursts
Expression of pERK1/2 evoked by OT treatment in vitro and by suckling in vivo were highly similar, as were blocking effects of OTR antagonists on OT-evoked bursts (Wang and Hatton, 2007). These findings provide a firm basis to propose that OT is responsible for ERK1/2 activation in eliciting bursts in OT neurons during suckling. It is likely that activation of OTRs initiates intracellular signaling cascades via G-proteins (Wang and Hatton, 2007), leading to ERK1/2 activation. The roles of pERK1/2 in burst generation are not simply quantitative. OT-evoked bursts occurred when OT-elevated pERK1/2 began to decline from peak levels. Consistent with this in vitro phenomenon, pERK1/2 expression decreased immediately after milk ejections, a time when OT neurons are ready to be reactivated (Negoro et al., 1987). Decreases in pERK1/2 levels are at least partly responsible for postburst inhibition, judging from the inhibitory effect of PD98059 on firing rates. Alternatively, the distribution pattern immediately after the milk ejection allows pERK1/2 to retain the potential to be reactivated without relocation in response to appropriate stimuli (Negoro et al., 1987). Thus, ERK1/2 activation, a prerequisite for burst generation, may function in a microdomain-specific manner.
Subcellular distribution of pERK1/2, particularly when it is in close proximity to the membrane, is probably more important than general cytosolic or nuclear distribution. Clearly, suckling increased pERK1/2 expression at cytosolic sites close to the membrane, dramatically during the period when OT neurons were ready to burst. From the observed dual effects of OT on pERK1/2 expression, we assume that OT can both activate and deactivate pERK1/2, with activation dominant at early times and deactivation stronger during later stages. Commonly, when activation pathways are blocked, deactivation becomes dominant, e.g., phosphatases in the striatum (Paul et al., 2003). Because the downstream signals to pERK1/2 are broad, both burst-suppressing and burst-evoking signals may be included. Selectively activating and deactivating pERK1/2 in specific microdomains may remove burst-suppressing signals unmasking burst-evoking signals. From initial ERK1/2 activation to burst generation, there is a long latency. Thus, OT- or suckling-elicited global ERK1/2 activation may in turn activate secondary burst-evoking signals rather than to directly elicit burst onset. These signals may originate from both magnocellular neurons and astrocytes, because accompanying the changes in pERK1/2 levels in OT neurons were nuclear translocations of pERK1/2 in astrocytes. As with OT neurons, astrocytes can provide prostaglandins (Wang and Hatton, 2006) to trigger bursts in OT neurons (Hatton and Wang, 2005).
Actin reorganization and OT-evoked bursts
Actin dynamics are implicated in functions of ionotropic receptors (Allison et al., 1998; Liu and Berg, 1999), ion channels (Schubert and Akopian, 2004; Yang et al., 2004; Zhong and Zucker, 2004), gap junction formation (Pavlik et al., 2004), and synaptic plasticity (Okamoto et al., 2004). Compared with other signals, actin possesses more capacity to anchor other signaling molecules to electrogenic organelles, alters their activity directly, and leads to transient electrical discharges of neurons. In this study, blocking ERK1/2 activation also reduced F-actin formation both in vivo and in vitro. After cytochalasin B-evoked inhibition set in, OT lost its burst-evoking capability. These results highlight the importance of actin dynamics in burst generation.
It seems paradoxical that both stabilization and destabilization of F-actin could trigger bursts. However, analyzing the relationship between burst generation and F-actin distribution, we found that membrane subcortical F-actin location plays a crucial role in burst generation. Suckling increased F-actin and the incidence of F-actin ring formation/cellular apposition. When OT neurons were ready to be reactivated (immediately after milk ejections), incidence of F-actin rings abounded. Moreover, these rings were well preserved shortly after application of cytochalasin B, despite strong suppression of general cytosolic F-actin. Stabilization of F-actin facilitated OT-evoked bursts by promoting OT actions, whereas destabilizing F-actin blocked OT-evoked bursts. This apparent paradoxical outcome could be related to different pools of F-actin: a cytochalasin B-sensitive pool at paranuclear cytosolic sites and in astrocytic processes, and a membrane subcortical cytochalasin B-insensitive pool. The former are ready to be polymerized and may form a spatial barrier (Tobin and Ludwig, 2007) for access of burst-evoking signals to electrogenic organelles, e.g., release of prostaglandin, OT and ATP, etc. The latter pool is essential for burst generation; it is likely depolymerized slowly but not easily replaced by newly polymerized actin. This may explain the spontaneous bursts at early stages of actin-disrupting agent application and how OT could quickly increase the paranuclear cytosolic F-actin, but not membrane subcortical F-actin, in OT neurons in the presence of cytochalasin B.
Initial increases in F-actin are likely associated with ERK1/2 activation and prostaglandin production (Wang and Hatton, 2006). Blocking ERK1/2 activation reduced basal F-actin levels, indicating the dependence of F-actin formation on pERK1/2 expression. Later decreases in F-actin during prolonged OT actions may be attributable to activation of cofilin (Nebl et al., 2004), via dephosphorylation, after the reduction in pERK1/2 level (Pritchard et al., 2004). Dephosphorylated cofilin can sever actin filaments. Cell–cell apposition/ring-like F-actin structures could result from coordinated actions of the two forces in a microdomain-specific manner, e.g., polymerization dominant at membrane subcortical areas in OT neurons and astrocytic somata with more pERK1/2 present, and depolymerization at paranuclear cytosolic areas in OT neurons and astrocytic processes in which less pERK1/2 is present.
The involvement of astrocytic F-actin in burst generation may be related to additional retractions of astrocytic processes from the spaces between adjacent neurons (Hatton and Tweedle, 1982). Apparently reduced glial insulation between neurons during suckling contributed to F-actin ring formation or cellular apposition between OT neurons. Disruption of F-actin in astrocytes by bath application of actin-disrupting agents may contribute to glial retraction and their burst-evoking actions. Astrocytic retraction during lactation has been proposed as a mechanism underlying bursts in OT neurons (Hatton, 1990; Hatton, 2004); the present results extend the relevance of this mechanism to periods of suckling.
Interactions between pERK1/2 and F-actin
Actin dynamically interacts with pERK1/2 in neurons (Julien and Mushynski, 1998; Choe et al., 2002; Watanabe et al., 2004; Chierzi et al., 2005; Gu et al., 2005) and participates in relocation of signaling molecules. In the SON, expression of pERK1/2 and F-actin was temporally associated with responses to OT/suckling. Blocking pERK1/2 formation disrupted the pattern of F-actin reorganization. OT partially restored F-actin ring structures after blocking ERK1/2 activation, indicating the existence of pERK1/2 independent compensatory pathways for F-actin formation in OT neurons. Alternatively, F-actin suppressed basal ERK1/2 activation but was responsible for OT-evoked ERK1/2 activation and for pERK1/2 translocalization. Theoretically, this may be attributable to a spatial barrier effect of F-actin for MEK1/2 to access ERK1/2 or for phosphatases to separate from pERK1/2. ERK1/2 may need actin dynamics to bring it to MEK1/2 or to shield phosphatases from pERK1/2 during OT or suckling stimulation. These events should be spatiotemporally associated.
The influence of actin dynamics on burst generation may be chiefly via its guiding role in pERK1/2 functions. Although it is possible for pERK1/2 to modulate ion channel activity directly (Hu et al., 2003), the scaffolding and guiding roles of F-actin in ERK1/2 activation provide an optimal condition for direct interactions between pERK1/2 and the electrogenic organelles in OT neuronal membranes. Possibly, the negative influence of disturbing F-actin dynamics on burst generation is related to dissociation of newly activated ERK1/2 from F-actin. With the loss of pERK1/2, and other possible factors modulating membrane excitability, OT failed to trigger additional bursts. Conversely, phalloidin may facilitate burst generation by stabilizing F-actin, thereby maintaining close interactions between pERK1/2, F-actin, and electrogenic organelles.
It should be noted that interactions between pERK1/2 and F-actin are not homogeneous among OT neurons and astrocytes. Besides robustly responsive cells in our results, there were non-responsive or weakly responsive cells. Vasopressin neurons were also involved in the interactions. Additional study may uncover more complex mechanisms.
Implications
The present findings highlight essential roles of actin dynamics and pERK1/2 in burst firing patterns and reveal, for the first time, multiple interactions between the two molecules. Figure 8 diagrams the interactions between pERK1/2 and F-actin in SON OT neurons and astrocytes that likely lead to burst generation. Understanding these mechanisms should also be useful in revealing the machinery involved in firing pattern transitions of other neurons under different physiological conditions.
Figure 8.

Schematic drawings of translocations and interactions of pERK1/2 and F-actin in suckling-evoked bursts. A, Responses of SON OT neurons (A1), astrocytes (A2), and presynaptic glutamate and GABA terminals (A3) to OT during suckling. B, Effects of pERK1/2 on actin dynamics in OT neurons. OT causes ERK1/2 activation likely via OTR (red hemi-circles)-associated G-proteins (Zhong et al., 2003; Wang and Hatton, 2007) and ERK kinase, MEK. pERK1/2 can facilitate F-actin formation through at least two pathways: by increasing production of prostaglandins (PGs) (Wang and Hatton, 2006) and by phosphorylating cofilin (P-cofilin) (phosphorylation of cofilin inhibits its ability to depolymerize F-actin) (Nebl et al., 2004; Pritchard et al., 2004). Increased F-actin formation, particularly at membrane subcortical areas, increases inward Na+ currents and OT neuronal excitability. Increased pERK1/2 may also activate protein phosphatases (PP) (Paul et al., 2003), leading to dephosphorylation of pERK1/2, activation of cofilin, and F-actin depolymerization. Microdomain-specific pERK1/2 expression determines patterns of F-actin distribution. C, Effects of actin dynamics on pERK1/2 expression. F-actin formation elicited by OT and prostaglandins may form a barrier for MEK to access ERK1/2 or to bring protein phosphatases close to pERK1/2, whereas actin depolymerization allows ERK1/2 activation. However, detaching from F-actin, ERK1/2 activation occurs without special localization, appearing as diffuse increases in pERK1/2. Alternatively, dynamic F-actin formation may continue recruiting ERK1/2 to the actin cytoskeleton and MEK and increase ERK1/2 activation while migrating to cytosolic loci and membrane subcortical areas. This location allows pERK1/2 to access membrane electrogenic organelles and cause burst-facilitating responses, e.g., suppressing K+ currents. D, Events leading to burst generation and its effects. A series of spatiotemporal changes in cellular signals sets OT neurons in a state subthreshold to bursting. Transient discharges of clustered EPSCs (Wang and Hatton, 2007) and reduced K+ currents (Wang and Hatton, 2004) will trigger burst firing directly. After the burst, membrane electrochemical events may cause partial depolymerization of F-actin and dephosphorylation of pERK1/2. However, the membrane subcortical F-actin layer remains intact shortly after the burst, together with its associated ERK1/2 and pERK1/2, which allows secondary bursts in OT neurons after appropriate stimulation (Negoro et al., 1987).
Footnotes
This work was supported by National Institutes of Health Grant NS009140. We thank Dr. T. A. Ponzio for critical comments on an early draft of this manuscript.
References
- Alessi DR, Cuenda A, Cohen P, Dudley DT, Saltiel AR. PD 098059 is a specific inhibitor of the activation of mitogen-activated protein kinase kinase in vitro and in vivo. J Biol Chem. 1995;270:27489–27494. doi: 10.1074/jbc.270.46.27489. [DOI] [PubMed] [Google Scholar]
- Allison DW, Gelfand VI, Spector I, Craig AM. Role of actin in anchoring postsynaptic receptors in cultured hippocampal neurons: differential attachment of NMDA versus AMPA receptors. J Neurosci. 1998;18:2423–2436. doi: 10.1523/JNEUROSCI.18-07-02423.1998. [DOI] [PMC free article] [PubMed] [Google Scholar]
- Armstrong WE. Morphological and electrophysiological classification of hypothalamic supraoptic neurons. Prog Neurobiol. 1995;47:291–339. [PubMed] [Google Scholar]
- Bealer SL, Crowley WR. Histaminergic control of oxytocin release in the paraventricular nucleus during lactation in rats. Exp Neurol. 2001;171:317–322. doi: 10.1006/exnr.2001.7770. [DOI] [PubMed] [Google Scholar]
- Burns PD, Mendes JO, Jr, Yemm RS, Clay CM, Nelson SE, Hayes SH, Silvia WJ. Cellular mechanisms by which oxytocin mediates ovine endometrial prostaglandin F2alpha synthesis: role of G(i) proteins and mitogen-activated protein kinases. Biol Reprod. 2001;65:1150–1155. doi: 10.1095/biolreprod65.4.1150. [DOI] [PubMed] [Google Scholar]
- Chierzi S, Ratto GM, Verma P, Fawcett JW. The ability of axons to regenerate their growth cones depends on axonal type and age, and is regulated by calcium, cAMP and ERK. Eur J Neurosci. 2005;21:2051–2062. doi: 10.1111/j.1460-9568.2005.04066.x. [DOI] [PubMed] [Google Scholar]
- Choe Y, Lee BJ, Kim K. Participation of protein kinase C alpha isoform and extracellular signal-regulated kinase in neurite outgrowth of GT1 hypothalamic neurons. J Neurochem. 2002;83:1412–1422. doi: 10.1046/j.1471-4159.2002.01246.x. [DOI] [PubMed] [Google Scholar]
- Crowley WR, Armstrong WE. Neurochemical regulation of oxytocin secretion in lactation. Endocr Rev. 1992;13:33–65. doi: 10.1210/edrv-13-1-33. [DOI] [PubMed] [Google Scholar]
- Davies SP, Reddy H, Caivano M, Cohen P. Specificity and mechanism of action of some commonly used protein kinase inhibitors. Biochem J. 2000;351:95–105. doi: 10.1042/0264-6021:3510095. [DOI] [PMC free article] [PubMed] [Google Scholar]
- Faingold CL. Emergent properties of CNS neuronal networks as targets for pharmacology: application to anticonvulsant drug action. Prog Neurobiol. 2004;72:55–85. doi: 10.1016/j.pneurobio.2003.11.003. [DOI] [PubMed] [Google Scholar]
- Favata MF, Horiuchi KY, Manos EJ, Daulerio AJ, Stradley DA, Feeser WS, Van Dyk DE, Pitts WJ, Earl RA, Hobbs F, Copeland RA, Magolda RL, Scherle PA, Trzaskos JM. Identification of a novel inhibitor of mitogen-activated protein kinase kinase. J Biol Chem. 1998;273:18623–18632. doi: 10.1074/jbc.273.29.18623. [DOI] [PubMed] [Google Scholar]
- Freund-Mercier MJ, Richard P. Excitatory effects of intraventricular injections of oxytocin on the milk ejection reflex in the rat. Neurosci Lett. 1981;23:193–198. doi: 10.1016/0304-3940(81)90039-2. [DOI] [PubMed] [Google Scholar]
- Freund-Mercier MJ, Richard P. Oxytocin as a putative factor in the control of periodic and synchronized neurosecretory bursts of oxytocinergic cells (in French) C R Seances Acad Sci III. 1982;294:497–500. [PubMed] [Google Scholar]
- Freund-Mercier MJ, Richard P. Electrophysiological evidence for facilitatory control of oxytocin neurones by oxytocin during suckling in the rat. J Physiol (Lond) 1984;352:447–466. doi: 10.1113/jphysiol.1984.sp015302. [DOI] [PMC free article] [PubMed] [Google Scholar]
- Gimpl G, Fahrenholz F. The oxytocin receptor system: structure, function, and regulation. Physiol Rev. 2001;81:629–683. doi: 10.1152/physrev.2001.81.2.629. [DOI] [PubMed] [Google Scholar]
- Gu Z, Jiang Q, Fu AK, Ip NY, Yan Z. Regulation of NMDA receptors by neuregulin signaling in prefrontal cortex. J Neurosci. 2005;25:4974–4984. doi: 10.1523/JNEUROSCI.1086-05.2005. [DOI] [PMC free article] [PubMed] [Google Scholar]
- Hatton GI. Emerging concepts of structure-function dynamics in adult brain: the hypothalamo-neurohypophysial system. Prog Neurobiol. 1990;34:437–504. doi: 10.1016/0301-0082(90)90017-b. [DOI] [PubMed] [Google Scholar]
- Hatton GI. Morphological plasticity of astroglial/neuronal interactions: functional implications. In: Hatton GI, Parpura V, editors. glial neuronal signaling. Boston: Kluwer Academic; 2004. pp. 99–124. [Google Scholar]
- Hatton GI, Tweedle CD. Magnocellular neuropeptidergic neurons in hypothalamus: increases in membrane apposition and number of specialized synapses from pregnancy to lactation. Brain Res Bull. 1982;8:197–204. doi: 10.1016/0361-9230(82)90046-6. [DOI] [PubMed] [Google Scholar]
- Hatton GI, Wang Y-F. Signal transduction pathway underlying oxytocin-evoked burst firing in oxytocin neurons. Soc Neurosci Abstr. 2005;31:993–8. [Google Scholar]
- Hoare S, Copland JA, Strakova Z, Ives K, Jeng YJ, Hellmich MR, Soloff MS. The proximal portion of the COOH terminus of the oxytocin receptor is required for coupling to g(q), but not g(i). Independent mechanisms for elevating intracellular calcium concentrations from intracellular stores. J Biol Chem. 1999;274:28682–28689. doi: 10.1074/jbc.274.40.28682. [DOI] [PubMed] [Google Scholar]
- Hu HJ, Glauner KS, Gereau RW. ERK integrates PKA and PKC signaling in superficial dorsal horn neurons. I. Modulation of A-type K+ currents. J Neurophysiol. 2003;90:1671–1679. doi: 10.1152/jn.00340.2003. [DOI] [PubMed] [Google Scholar]
- Julien JP, Mushynski WE. Neurofilaments in health and disease. Prog Nucleic Acid Res Mol Biol. 1998;61:1–23. doi: 10.1016/s0079-6603(08)60823-5. [DOI] [PubMed] [Google Scholar]
- Krahe R, Gabbiani F. Burst firing in sensory systems. Nat Rev Neurosci. 2004;5:13–23. doi: 10.1038/nrn1296. [DOI] [PubMed] [Google Scholar]
- Liu Q, Berg DK. Actin filaments and the opposing actions of CaM kinase II and calcineurin in regulating α7-containing nicotinic receptors on chick ciliary ganglion neurons. J Neurosci. 1999;19:10280–10288. doi: 10.1523/JNEUROSCI.19-23-10280.1999. [DOI] [PMC free article] [PubMed] [Google Scholar]
- Nebl G, Fischer S, Penzel R, Samstag Y. Dephosphorylation of cofilin is regulated through Ras and requires the combined activities of the Ras-effectors MEK and PI3K. Cell Signal. 2004;16:235–243. doi: 10.1016/s0898-6568(03)00133-5. [DOI] [PubMed] [Google Scholar]
- Negoro H, Uchide K, Tadokoro Y, Honda K, Higuchi T. Vaginal distension induces milk ejection-related burst of oxytocin neurones interacting with suckling stimuli in lactating rats. Brain Res. 1987;404:371–374. doi: 10.1016/0006-8993(87)91397-7. [DOI] [PubMed] [Google Scholar]
- Neumann I, Koehler E, Landgraf R, Summy-Long J. An oxytocin receptor antagonist infused into the supraoptic nucleus attenuates intranuclear and peripheral release of oxytocin during suckling in conscious rats. Endocrinology. 1994;134:141–148. doi: 10.1210/endo.134.1.8275928. [DOI] [PubMed] [Google Scholar]
- Okamoto K, Nagai T, Miyawaki A, Hayashi Y. Rapid and persistent modulation of actin dynamics regulates postsynaptic reorganization underlying bidirectional plasticity. Nat Neurosci. 2004;7:1104–1112. doi: 10.1038/nn1311. [DOI] [PubMed] [Google Scholar]
- Paterson JA, Leblond CP. Increased proliferation of neuroglia and endothelial cells in the supraoptic nucleus and hypophysial neural lobe of young rats drinking hypertonic sodium chloride solution. J Comp Neurol. 1977;175:373–390. doi: 10.1002/cne.901750402. [DOI] [PubMed] [Google Scholar]
- Paul S, Nairn AC, Wang P, Lombroso PJ. NMDA-mediated activation of the tyrosine phosphatase STEP regulates the duration of ERK signaling. Nat Neurosci. 2003;6:34–42. doi: 10.1038/nn989. [DOI] [PubMed] [Google Scholar]
- Pavlik LL, Bezgina EN, Tiras NP, Mikheeva IV, Udal'tsov SN, Moshkov DA. Substances affecting gap junction conductivity and Mauthner neuron mixed synapses (in Russian) Morfologiia. 2004;125:26–31. [PubMed] [Google Scholar]
- Paxinos G, Watson C. Tokyo: Academic; 1986. The rat brain in stereotaxic coordinates. [DOI] [PubMed] [Google Scholar]
- Pittman QJ, Hirasawa M, Mouginot D, Kombian SB. Neurohypophysial peptides as retrograde transmitters in the supraoptic nucleus of the rat. Exp Physiol. 2000:139S–143S. doi: 10.1111/j.1469-445x.2000.tb00017.x. 85 Spec No. [DOI] [PubMed] [Google Scholar]
- Pritchard CA, Hayes L, Wojnowski L, Zimmer A, Marais RM, Norman JC. B-Raf acts via the ROCKII/LIMK/cofilin pathway to maintain actin stress fibers in fibroblasts. Mol Cell Biol. 2004;24:5937–5952. doi: 10.1128/MCB.24.13.5937-5952.2004. [DOI] [PMC free article] [PubMed] [Google Scholar]
- Reversi A, Rimoldi V, Marrocco T, Cassoni P, Bussolati G, Parenti M, Chini B. The oxytocin receptor antagonist atosiban inhibits cell growth via a “biased agonist” mechanism. J Biol Chem. 2005;280:16311–16318. doi: 10.1074/jbc.M409945200. [DOI] [PubMed] [Google Scholar]
- Schubert T, Akopian A. Actin filaments regulate voltage-gated ion channels in salamander retinal ganglion cells. Neuroscience. 2004;125:583–590. doi: 10.1016/j.neuroscience.2004.02.009. [DOI] [PubMed] [Google Scholar]
- Smithson KG, Hatton GI. Immunocytochemical identification of electrophysiologically characterized cells in brain slices. In: Hokfelt T, editor. Handbook of chemical neuroanatomy. Amsterdam: Elsevier; 1990. pp. 305–350. [Google Scholar]
- Tobin VA, Ludwig M. The role of the actin cytoskeleton in oxytocin and vasopressin release from rat supraoptic nucleus neurons. J Physiol (Lond) 2007;582:1337–1348. doi: 10.1113/jphysiol.2007.132639. [DOI] [PMC free article] [PubMed] [Google Scholar]
- Wakerley JB, Clarke G, Summerlee AJ. Milk ejection and its control. In: Knobil E, Neill JD, editors. The physiology of reproduction. New York: Raven; 1994. pp. 1131–1177. [Google Scholar]
- Wang YF, Hatton GI. Milk ejection burst-like electrical activity evoked in supraoptic oxytocin neurons in slices from lactating rats. J Neurophysiol. 2004;91:2312–2321. doi: 10.1152/jn.00697.2003. [DOI] [PubMed] [Google Scholar]
- Wang YF, Hatton GI. Mechanisms underlying oxytocin-induced excitation of supraoptic neurons: prostaglandin mediation of actin polymerization. J Neurophysiol. 2006;95:3933–3947. doi: 10.1152/jn.01267.2005. [DOI] [PubMed] [Google Scholar]
- Wang YF, Hatton GI. Dominant role of βγ subunits of G-proteins in oxytocin-evoked burst firing. J Neurosci. 2007;27:1902–1912. doi: 10.1523/JNEUROSCI.5346-06.2007. [DOI] [PMC free article] [PubMed] [Google Scholar]
- Watanabe H, Yokozeki T, Yamazaki M, Miyazaki H, Sasaki T, Maehama T, Itoh K, Frohman MA, Kanaho Y. Essential role for phospholipase D2 activation downstream of ERK MAP kinase in nerve growth factor-stimulated neurite outgrowth from PC12 cells. J Biol Chem. 2004;279:37870–37877. doi: 10.1074/jbc.M402610200. [DOI] [PubMed] [Google Scholar]
- Yang Y, Lacas-Gervais S, Morest DK, Solimena M, Rasband MN. BetaIV spectrins are essential for membrane stability and the molecular organization of nodes of Ranvier. J Neurosci. 2004;24:7230–7240. doi: 10.1523/JNEUROSCI.2125-04.2004. [DOI] [PMC free article] [PubMed] [Google Scholar]
- Zhong M, Yang M, Sanborn BM. Extracellular signal-regulated kinase1/2 activation by myometrial oxytocin receptor involves Galpha(q)Gbetagamma and epidermal growth factor receptor tyrosine kinase activation. Endocrinology. 2003;144:2947–2956. doi: 10.1210/en.2002-221039. [DOI] [PubMed] [Google Scholar]
- Zhong N, Zucker RS. Roles of Ca2+, hyperpolarization and cyclic nucleotide-activated channel activation, and actin in temporal synaptic tagging. J Neurosci. 2004;24:4205–4212. doi: 10.1523/JNEUROSCI.0111-04.2004. [DOI] [PMC free article] [PubMed] [Google Scholar]
- Zlatnik MG, Copland JA, Ives K, Soloff MS. Functional oxytocin receptors in a human endometrial cell line. Am J Obstet Gynecol. 2000;182:850–855. doi: 10.1016/s0002-9378(00)70334-6. [DOI] [PubMed] [Google Scholar]