
Figure 2.
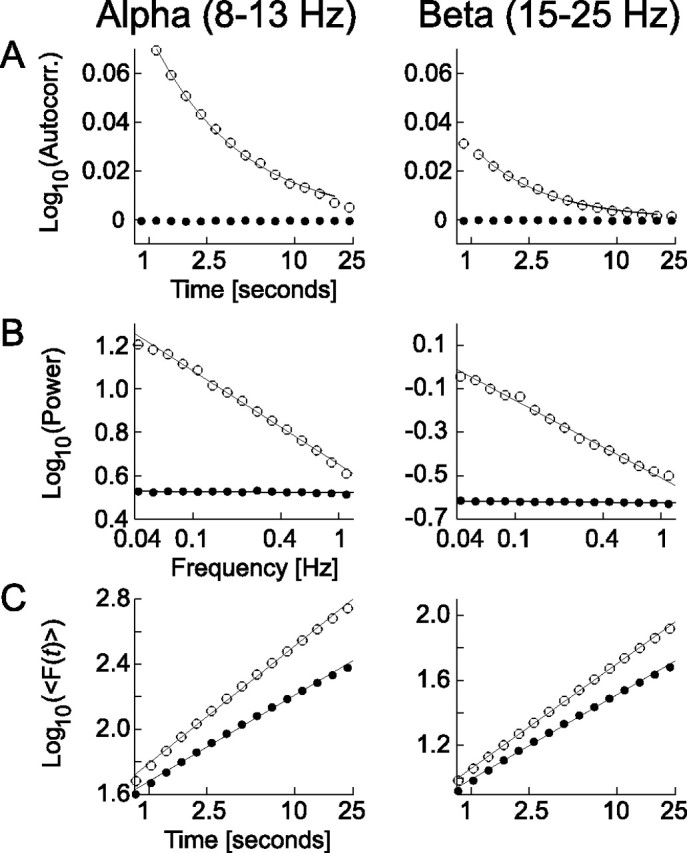
Power-law decaying correlations in the amplitude fluctuations of alpha- and beta-frequency band oscillations. Three complementary autocorrelation analyses were performed: the autocorrelation function (Autocorr., A), the power spectral density (Power, B), and the DFA (C). Each analysis was performed on the amplitude envelope of alpha and beta oscillations and averaged across the 368 subjects and 14 electrodes (open circles; see Materials and Methods). The data have been fitted with a power-law function on time scales from 1 to 20 s (black lines). The autocorrelation function is plotted semilogarithmically, because the autocorrelation function can attain negative values; power spectral density and DFA are plotted in log-log coordinates. Each analysis points to a slow decay of correlation or LRTC. The dots indicate the analysis of computer-generated white noise that is filtered identically to the EEG data. The autocorrelation function is zero at all time lags, the power spectrum is flat, and the DFA exponent is close to 0.5 for both frequency bands, showing that the bandpass filters did not introduce autocorrelations in the amplitude time series on the long time scales investigated here.