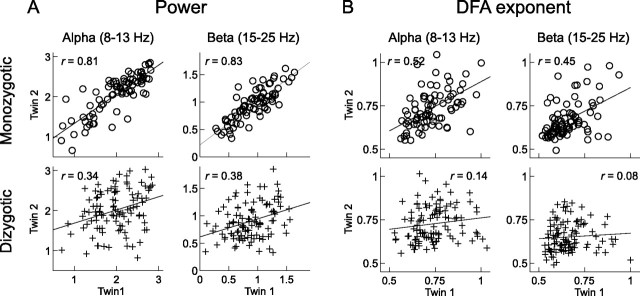
Figure 4.
Genetic factors shape the power and the temporal correlation structure of ongoing oscillations. The scatter plots show the logarithmically transformed power (A) and the DFA exponents (B) of monozygotic (circles, n = 80 pairs) and dizygotic (pluses, n = 104 pairs) twin pairs for alpha and beta at occipital electrode O2. That both power and DFA of alpha and beta oscillations are heritable traits is indicated by the more than two times higher correlation between monozygotic twins than between dizygotic twins. Twin correlations, r, are indicated in the plots.

