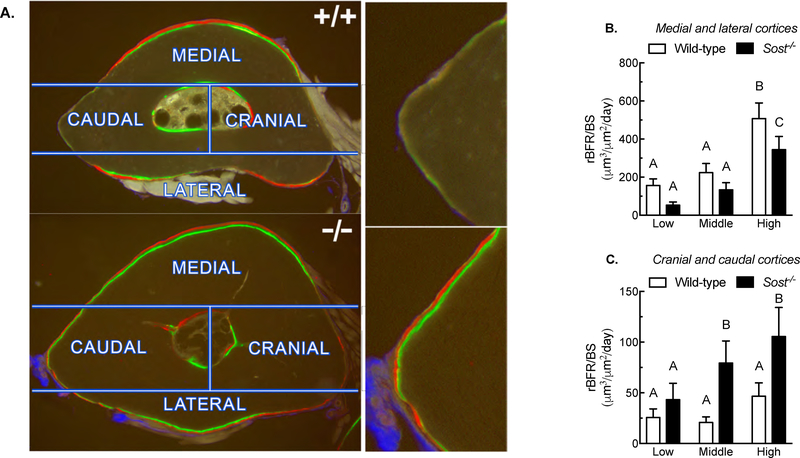
Figure 2. Distribution of new load-induced bone formation to high and low strain regions of the ulnar periosteal surface in wild-type and Sost−/− mice.
(A) Photomicrographs of fluorochrome-labeled ulnar sections with superimposed sectors used to partition bone formation measurements. The images reveal increased labeling along the neutral axis (caudal and cranial sectors) and decreased bone formation in the high strain sectors (medial and lateral sectors) in Sost−/− mice, compared to wild-type mice (images on right side of panel A are close-up views of the caudal cortex from the left panels). Quantification of bone formation rates pooled for high strain (medial and lateral) (B) and low strain (cranial and caudal) (C) regions indicate that Sost−/− mice were less efficient at localizing bone to the high strain surfaces than were wild-type mice. Different letters denote statistical differences among groups. n = 9–10/group.

