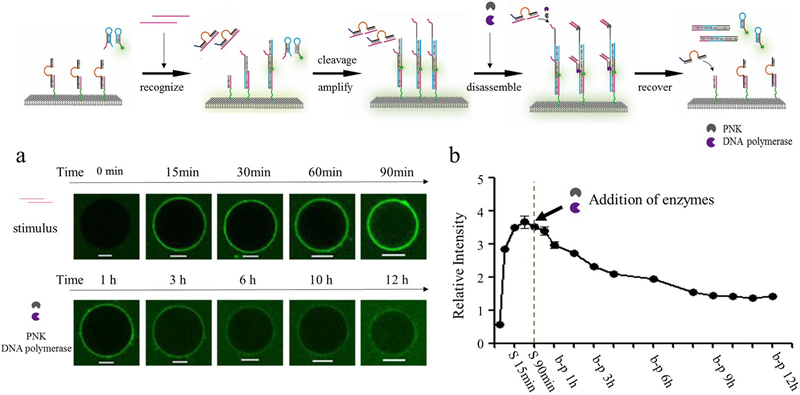
Figure 3.
Schematic representation of stimulus-induced DNA polymer assembly and disassembly after the addition of PNK and Bsm DNA polymerase. (a) Confocal images of DNA polymer anchored on membrane surface before (first panel) and after (second panel) the addition of PNK and Bsm DNA polymerase. (b) The mean fluorescence intensity of DNA polymer was calculated, and the plot shows the assembly and disassembly of DNA polymer in the presence of stimulus (S) and enzymes (b-p). Scale bar is 5 μm.

