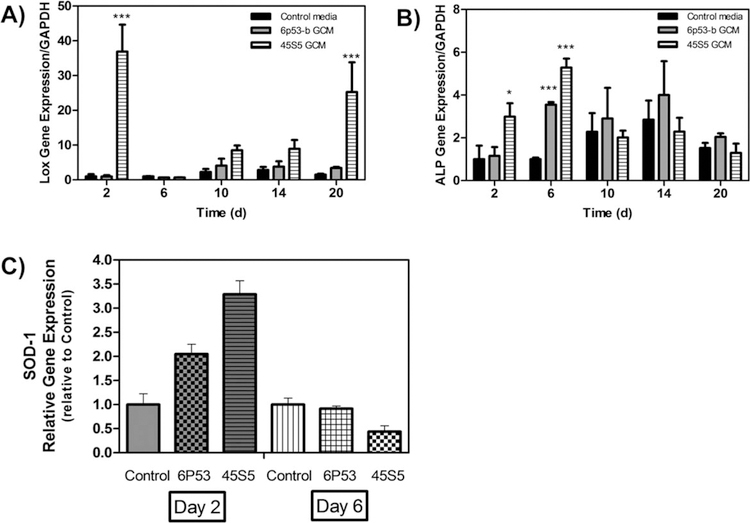
FIGURE 6.
Gene expression of LOX, ALP, and Sod1 Effect of 45S5 and 6P53-b GCM treatments on MC3T3-E1 subclone 4 expression of (A) lysil oxidase (LOX), (B) alkaline phosphatase (ALP), and (C) superoxide dismutase (Sod1) relative to control treatments. Data presented represent the means ± S.D. of triplicate experiments. Significant differences between treatments were determined by one-way ANOVA with Dunnett posttest comparison. *p < 0.05, **p < 0.01, ***p < 0.005 compared to control.

