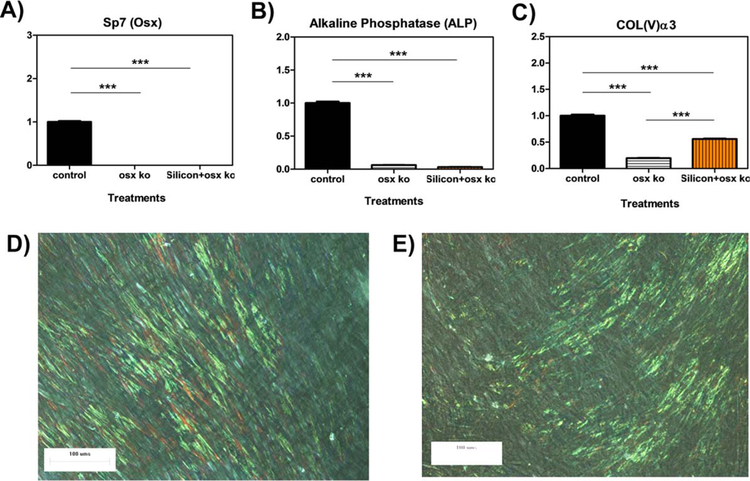
FIGURE 9.
OSX knock-down results for gene expression and collagen formation Relative gene expression of OSX, ALP, and Col(V)α3 by MC3T3-E1 subclone 4 cells treated with control media, OSX siRNA, and 100 µM Si + OSX siRNA for 72 h. Optical micrograph showing extracellular collagen fiber as result of MC3T3-E1 subclone 4 after day 6 post-treatment. MC3T3-E1 subclone 4 cells were exposed to (D) 100 µM silicon + OSX siRNA or (E) OSX siRNA. The presence of fibrillar collagen is seen as the greenish yellow streaks.

