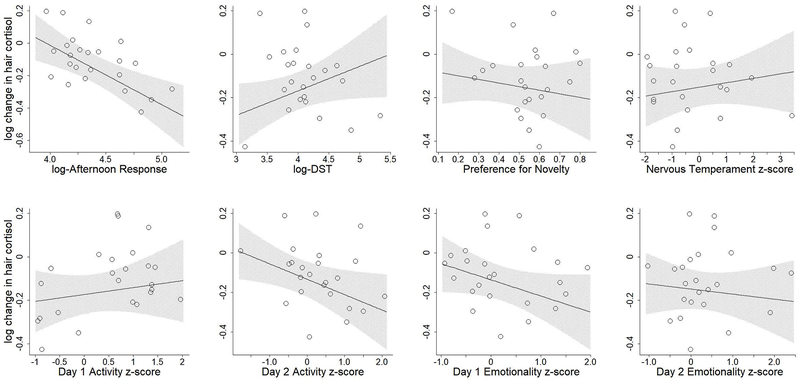
Figure2:
Nine Months Effects model-estimated change in hair cortisol concentrations relative to BioBehavioral Assessment measurements. Open circles represent individual datapoints. Line indicates mean expected change in hair cortisol concentration, holding other parameters constant. Shaded region indicates 95% confidence interval for mean. Note that estimated means were calculated assuming the individual was female and had average values for other parameters, and therefore raw datapoints are not directly comparable to estimated means.

