Figure 4.
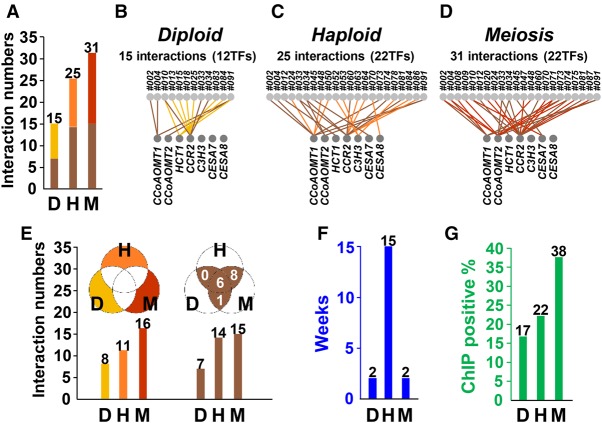
Comparison of experimental data obtained by three Y1H systems and in vivo validation. (A) Numbers of TF–DNA interactions identified from diploid-mating (D), haploid-transformation (H), and meiosis-directed (M) systems. (B–D) TF–DNA interactions identified in each of the three Y1H systems are graphically shown onto the GRN. The light gray circles on the top panel represent the TFs with interactions against the seven promotors (bottom panel; gray circles). (E) Numbers of TF–DNA interactions that appeared only in each system (yellow, orange, and red), and in more than two systems (brown). The color scheme matches that of A–D. (F) Blue bars represent the time of yeast strain production for the screening of 92 TFs against seven targeted promotors. (G) Percentages of TF–DNA interactions that could be in vivo validated by ChIP are shown in each Y1H system.

