Figure 5.
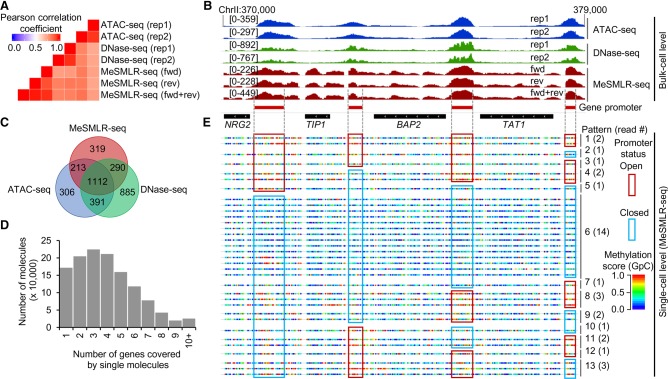
Performance evaluation of MeSMLR-seq on bulk-level chromatin accessibility mapping, and single-molecule long-range mapping of chromatin accessibility. (A) Correlation of chromatin accessibility profiles generated by MeSMLR-seq, ATAC-seq, and DNase-seq. (B) Chromatin accessibility profiles at the bulk-cell level provided by MeSMLR-seq, ATAC-seq, and DNase-seq. (C) Overlap of the significantly accessible regions (peaks) called by MeSMLR-seq, ATAC-seq, and DNase-seq. (D) Number of genes covered by single sequencing molecules of MeSMLR-seq data under 2% glucose condition. (E) Single-molecule long-range mapping of chromatin accessibility by MeSMLR-seq. Each line represents a molecule. GpC site is labeled as a rainbow-color dot, with methylation score from 0 (blue) to 1.0 (red). Thirteen combinatorial patterns of the promoter status of four genes are shown with different numbers of supporting sequencing molecules/cells. A promoter was defined as “open” (highlighted by red box) if the methylation scores of the including GpC sites had a median value greater than 0.5, and “closed” (highlighted by blue box) otherwise.

