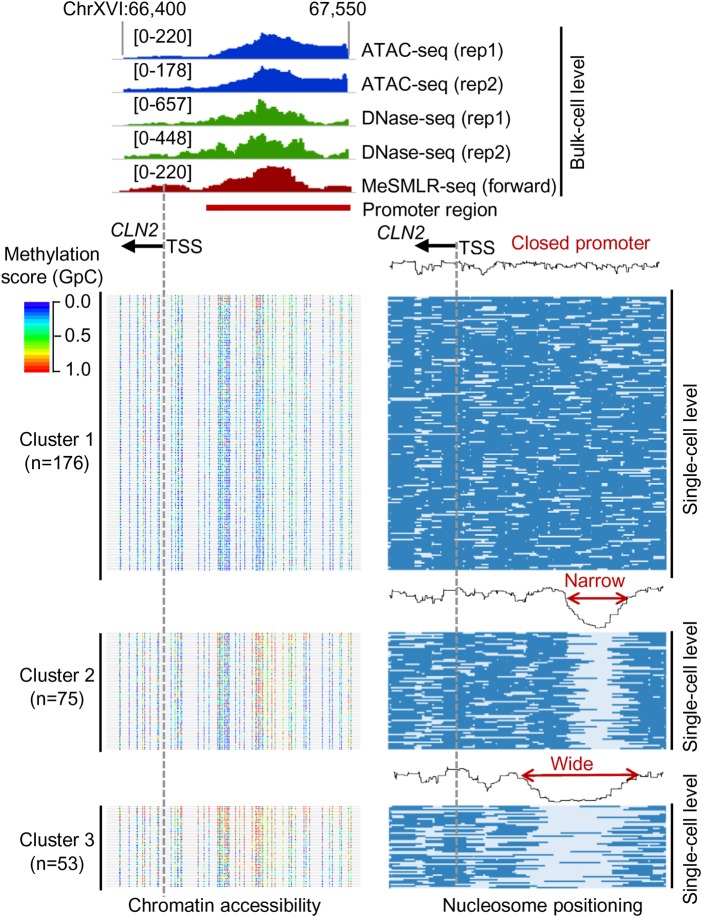
Figure 6.
Heterogeneous promoter openness of CLN2 in a cell population revealed by MeSMLR-seq. The bulk-level chromatin accessibility profiles (upper panel) were provided by ATAC-seq, DNase-seq, and MeSMLR-seq. MeSMLR-seq molecules were clustered into three groups with different promoter openness (by k-means clustering of the nucleosome occupancy profiles, bottom right panel): closed, narrow open, and wide open. Each row represents a molecule (i.e., a cell), and nucleosome is labeled as blue bar. The corresponding methylation profiles at GpC sites on each molecule are shown on the bottom left panel. Each line represents a molecule (i.e., a cell). GpC site is labeled as a rainbow-color dot, with methylation score from 0 (blue) to 1.0 (red).

