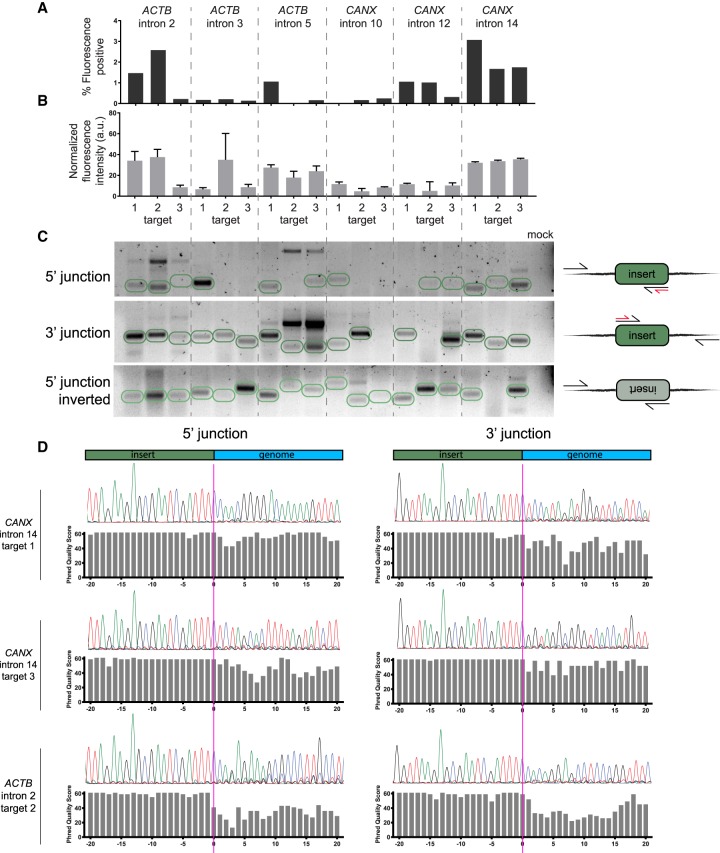
Figure 2.
Successful tagging is mostly determined by the choice of intron. (A) Tagging with mNG211 across introns in ACTB and CANX. Bar plots represent the percent of fluorescence-positive cells for each sgRNA position. (B) Expression mean and standard error for positive cells in each location. Sample sizes are proportional to the bar plots in A. (C) Gel image showing the amplification of donor-to-genomic DNA junctions, as illustrated in the right-hand diagrams. Expected band sizes for insertion of a single copy of donor are circled in green. In the diagrams, black arrows represent primer sites for amplification and red arrows represent primer sites for sequencing in D. The last lane corresponds to a PCR reaction with primers for CANX intron 14, target 1, but without a template. (D) Sanger sequencing of donor-to-genomic DNA junctions shows dephasing at the donor and genomic DNA junction, which indicates indels at the integration site.

