
Figure 4.
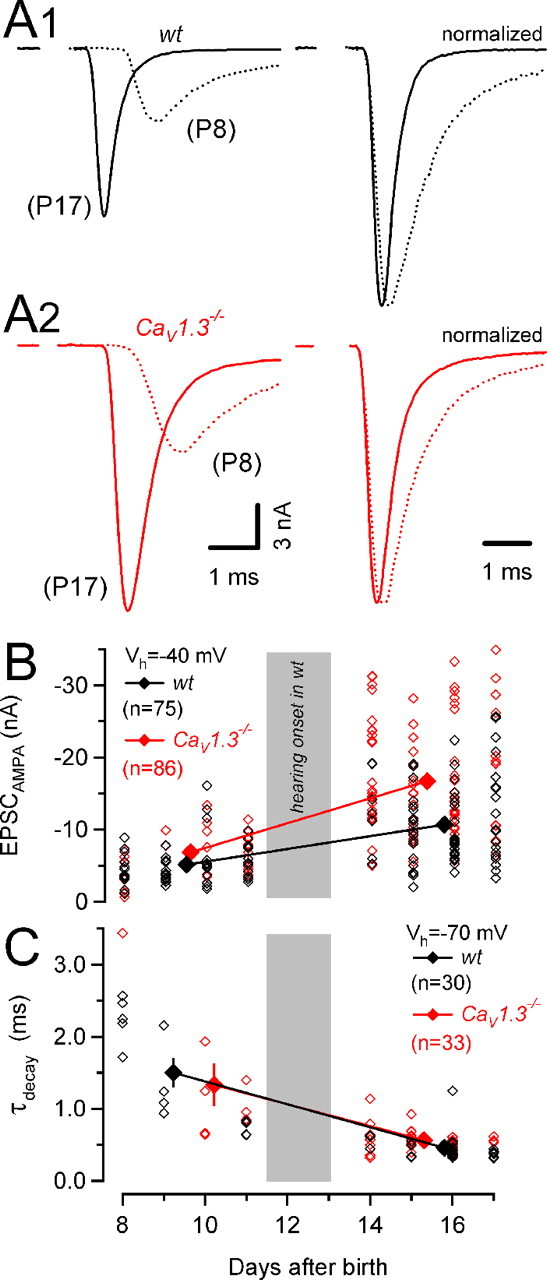
Larger AMPA eEPSC peak amplitudes in synapses of CaV1.3−/− mice. A, Representative AMPA receptor-mediated eEPSCs evoked by afferent fiber stimulation in synapses of wt (A1, left) and CaV1.3−/− (A2, left) mice (Vh = −40 mV). The right panel shows the same traces after normalizing their amplitudes. eEPSCs were aligned at their onsets to facilitate comparison of rise and decay kinetics. Kinetic properties of eEPSC in synapses of wt and those of CaV1.3−/− mice were similar. B, Scatter plot of AMPA EPSC peak amplitudes versus age. EPSC peak amplitudes varied over a widespread range at any developmental stage. However, the largest EPSCs were consistently recorded in synapses from CaV1.3−/− mice. At P14–P17, AMPA EPSCs from CaV1.3−/− mice (red) were on average 56% larger than those recorded in wt mice (black). C, Scatter plot of the weighted decay time constants of AMPA EPSCs. Developmental acceleration of AMPA EPSC kinetics proceeded similarly in wt and CaV1.3−/− mice.