
Figure 6.
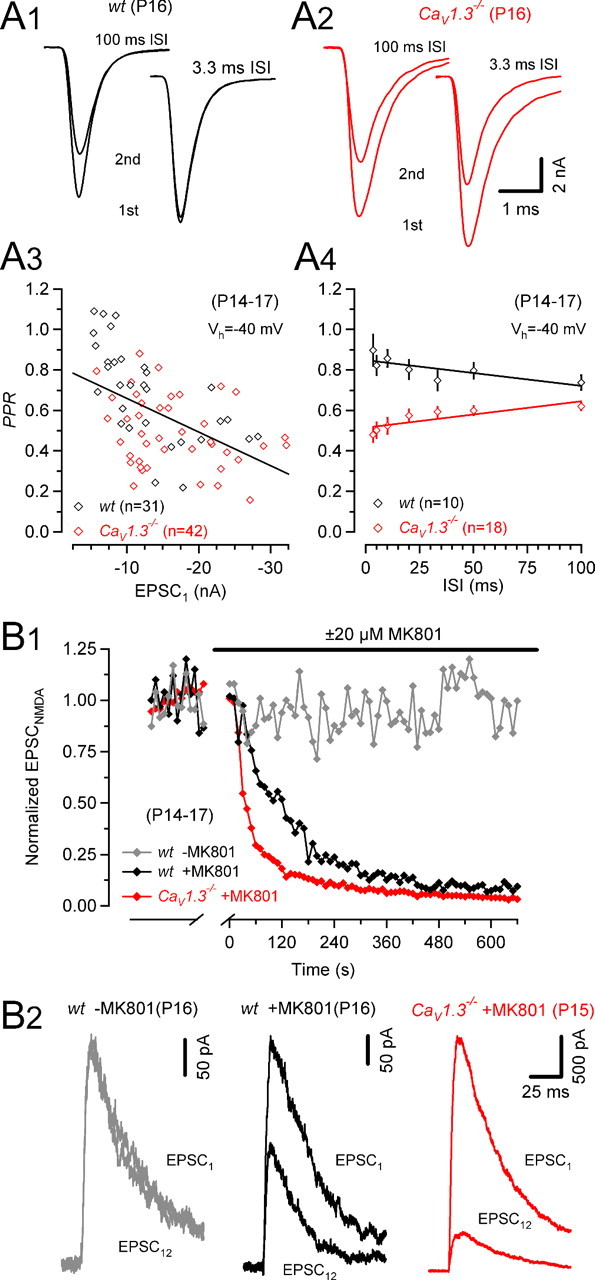
Higher probability of release in CaV1.3−/− mice. A, Paired-pulse ratios for various ISIs of P14–P17 synapses of wt (black) and CaV1.3−/− (red) mice. Representative recordings from a P16 wt (A1) and P16 CaV1.3−/− (A2) mouse. A3, Scatter plot of PPRs versus EPSC1 amplitudes (10 ms ISI) for wt (red) and CaV1.3−/− mice illustrating correlation between initial EPSC size and measured paired-pulse depression (r = 0.514; p < 0.001). A4, PPRs were generally smaller in CaV1.3−/− mice indicative of a higher release probability. With decreasing ISIs, PPRs increased in wt mice (r = −0.772; p = 0.04) presumably because of a facilitation of EPSC2. In CaV1.3−/− mice, PPRs decreased for shorter ISIs (r = 0.834; p = 0.02) possibly because AMPAR desensitization contributed to the reduction of EPSC2. Linear regressions in A3 and A4 are represented by the solid lines. B, Blocking time course of NMDA EPSCs by MK801 (20 μm). B1, NMDA EPSCs recorded at Vh = +40 mV (interstimulus interval 10 s) in the presence of 2 μm NBQX. After recording control EPSCs for 3 min, stimulation was stopped, and perfusion was switched to MK801 containing bath solution. MK801 was allowed to equilibrate in the recording chamber for 2 min before resuming fiber stimulation. The blocking time course was faster in the P16 CaV1.3−/− (red) compared with the P16 wt (black) mouse. For comparison, the time course of NMDA EPSC amplitudes was recorded in a P16 wt synapse in the absence of MK801 (gray). B2, First and 12th NMDA EPSCs recorded after resuming stimulation superimposed for comparison. Note the more complete block in the synapse from a CaV1.3−/− (red) compared with the wt (red) mouse.