
Figure 2.
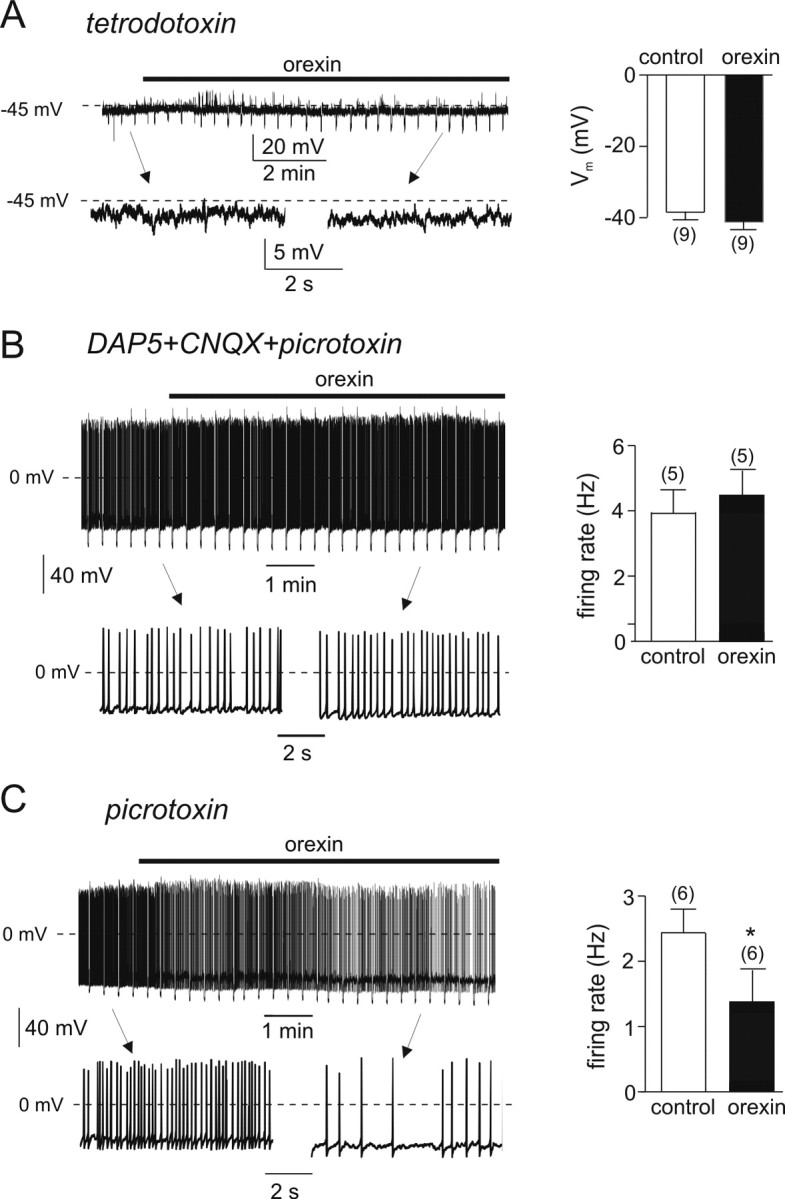
Effects of orexin on electrical activity in the presence of inhibitors of synaptic communication. Left panels, Representative membrane potential recordings. Top traces show complete recordings on a slow time scale. Orexin (100 nm) was applied during the bar. Downward voltage deflections are caused by periodic injections of hyperpolarizing current, which were applied to monitor membrane resistance (no significant changes were observed). Bottom traces show expanded sections of the top traces (as indicated) at a higher time resolution. The right panels show the mean membrane potential (A) or firing rate (B, C) in the presence and absence of orexin. Experiments were performed in the continuous presence of 1 μm tetrodotoxin (A), 50 μm d-AP-5 plus 10 μm CNQX plus 100 μm picrotoxin (B), or 100 μm picrotoxin (C). *p < 0.05. The numbers in parentheses indicate the number of cells.