
Figure 3.
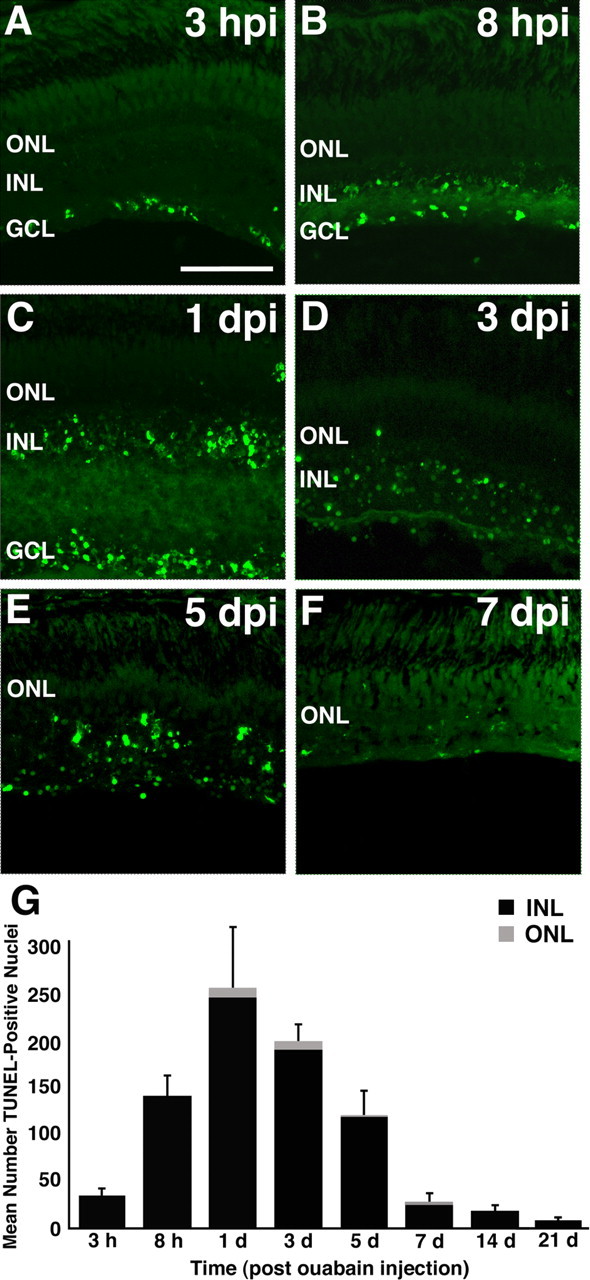
Progression of retinal cell death in the ouabain-damaged retina. A, Within 3 h of injecting a final concentration of 2 μm ouabain intravitreally, TUNEL-positive nuclei were detected exclusively in the GCL. B, C, At 8 and 24 hpi, a large number of TUNEL-positive nuclei were present in both the INL and the GCL, whereas very few labeled cells were detected in the ONL. D, E, As the inner retinal architecture was destroyed, large numbers of TUNEL-labeled cells were randomly distributed within the remainder of the inner retinal layers and only sparsely in the ONL. F, At 7 dpi, the number of TUNEL-positive cells had returned to the control levels. G, A graph of the number of TUNEL-positive cells (y-axis) in the dorsal retina plotted against the time after ouabain injection (x-axis). The number of TUNEL-positive nuclei in the ONL is represented as the lightly shaded bar, and the number of TUNEL-positive nuclei in the inner retina is represented as the black bar. Error bars represent SD (n = 6 retinas per time point). Scale bar, 75 μm.