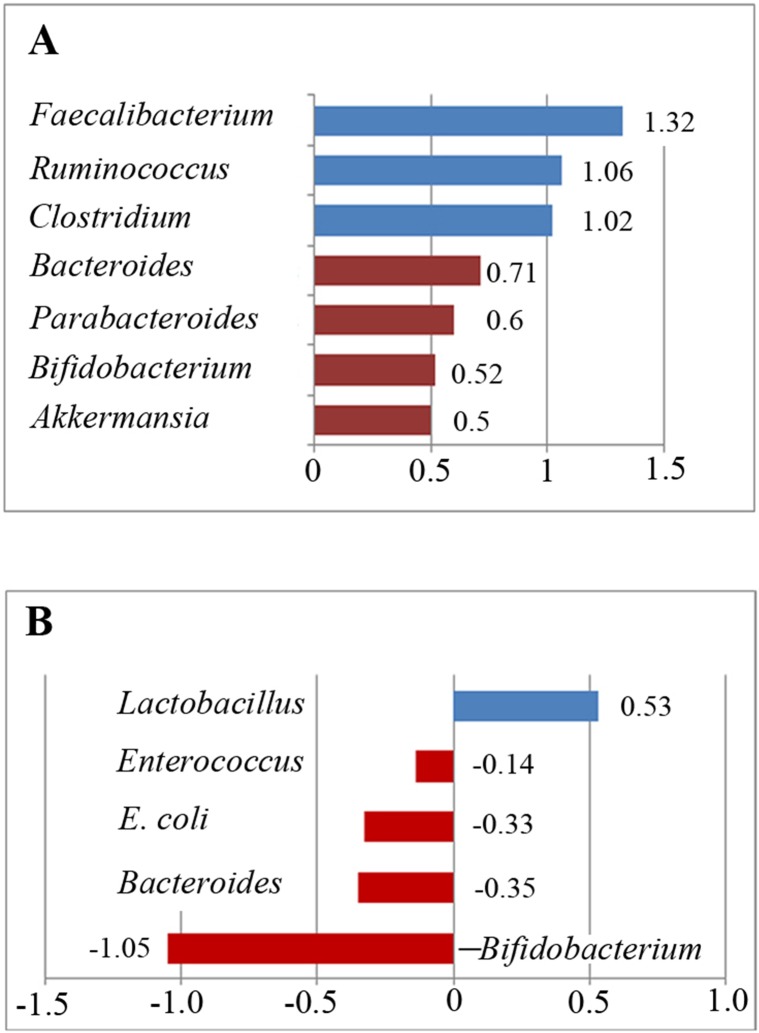
Figure 5.
Relative abundance of the included bacteria in the meta-analysis. (A) Ratio of the bacterial percentages in children with ASD and typically developing children. A value greater than 1 indicates higher abundance in children with ASD (Faecalibacterium, Ruminococcus, and Clostridium), whereas a value less than 1 indicates lower abundance in children with ASD compared to controls. (B) Relative abundance of the gut microbiota in children with ASD. A positive value indicates higher abundance in children with ASD (Lactobacillus), whereas a negative value indicates lower abundance in children with ASD.

