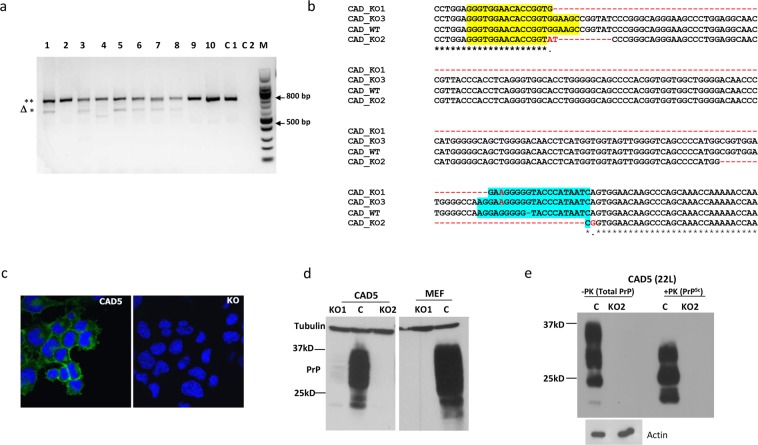
Figure 2.
Characterization of PrP-KO cells. (a) Genomic PCR from clonal isolates of CAD5-KO cells using PrP-F and PrP-R primers to amplify the complete 765 bp Prnp exon3. Lanes 1–10 represent PCR signature from single cell clones: the upper 765 bp (**) band represents the full-length exon 3 while the lower bands (Δ*) represent large deletions. Lane C1 represents the genomic PCR from the un-transfected CAD5 cells (control) and C2 represents the non-template negative control. M is the 100 bp molecular weight marker. (b) Sequence comparison of PCR amplicons (KO1, KO2 and KO3) from a representative single cell CAD5 knock out clone with original wild type (CAD_WT) demonstrating a range of indels between the two target sites. Yellow and blue regions represent the gRNA1 and gRNA2 sites, respectively. Large deletion in KO1 is represented by dotted line in red. Sequences in red represent indels. (c) Representative confocal microscopy image of parental CAD5 (left panel) and CAD5-KO2 cells (right panel) showing absence of PrP signal in KO cells. mAb 4H11 was used as primary and Alexa fluor 488 goat anti-mouse as secondary antibody. Nuclei were stained with DAPI. (d,e) Immunoblot analysis of single cell clones of CAD5 (KO1, KO2) and MEF cells (KO1) using mAb 4H11 showing absence of PrP expression. Lane C represents PrP expression of parental cells. Tubulin was used as a loading control. (f) Immunoblot analysis demonstrating prion propagation resistant phenotype of CAD5-KO2. Control CAD5 and KO2 cells were infected with 1% brain homogenate of terminally ill 22L-infected mice and cell lysates were subjected to PK digestion to distinguish between total PrP and PrPSc. (−PK) represents the total PrP and (+PK) represents PrPSc. The blots were probed with anti-PrP mAb 4H11 and actin was used as a loading control.

