
Figure 1.
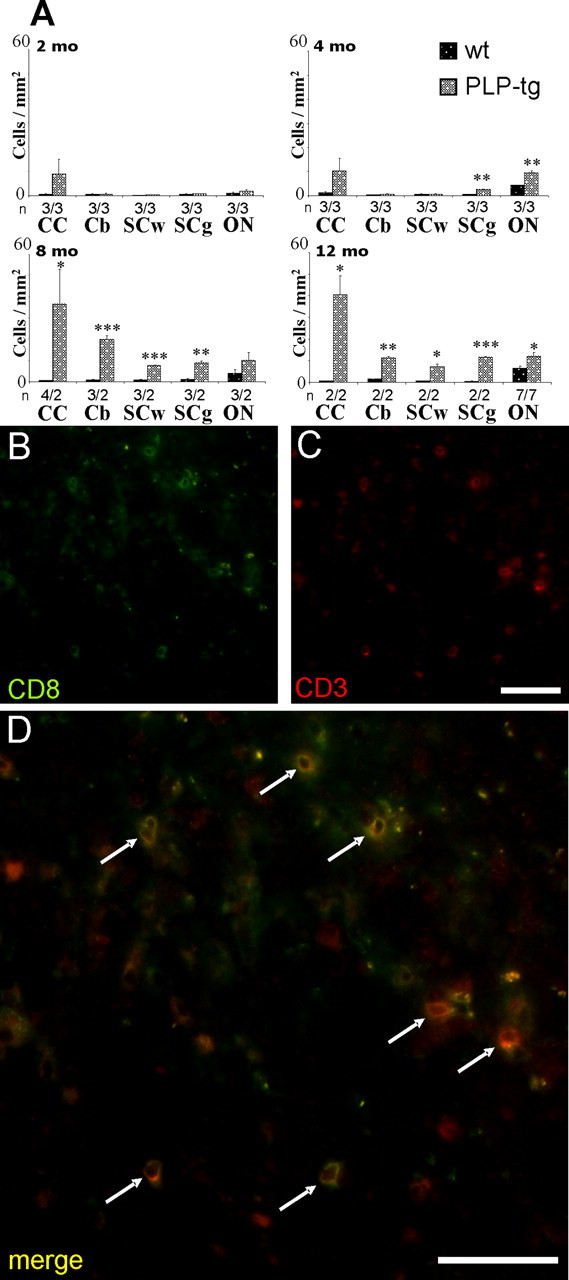
Elevated numbers of CD8+ T-lymphocytes in the CNS of PLP mutants. A, Quantification of CD8+ T-lymphocytes in corpus callosum (CC), cerebellum (Cb), white matter of the spinal cord (SCw), and gray matter of the spinal cord (SCg) and in the optic nerve (ON) of wt and PLP mutants (PLP-tg) at 2, 4, 8, and 12 months (mo) of age. Note age-dependent increase of the T-lymphocytes in the different regions of the CNS of the mutants. Mean values + SEM are indicated as well as the number of individuals investigated (n). Asterisks indicate statistical significance between values from the mutants compared with the values from wild-type mice: ∗p < 0.05, ∗∗p < 0.01, and ∗∗∗p < 0.001. B–D, Double-immunofluorescence staining for CD8+ cells (B, green color) and CD3+ T-lymphocytes (C, red color) in the corpus callosum of a PLP-tg mouse at 12 months of age. Note that all CD8+ cells are also CD3+, proving that the infiltrating CD8+ cells are T-lymphocytes (D, arrows). Scale bar, 50 μm.